Georgia’s prison crisis in numbers: 140% capacity. 100+ homicides in 2024. Black Georgians imprisoned at 3x the rate of white Georgians. The data reveals a system designed to incarcerate, not rehabilitate—and racial disparity built into every level. Georgia spends $1.72 billion annually on corrections while 70% goes to facility maintenance and only 30% reaches rehabilitation programs. These aren’t budgeting choices. They’re policy decisions that perpetuate mass incarceration. 1
Racial Disparity
Georgia’s prison population doesn’t reflect its general population:
- Black adults: 1,395 per 100,000 incarcerated
- White adults: 465 per 100,000 incarcerated
- Black Georgians are 32% of the state population but 63% of prisoners
- 25% higher probation revocation rates for Black Georgians
- 75% of youth prosecuted as adults are Black
Disparity has decreased 40% since 2000—but a 3:1 ratio remains. The policies that create overcrowding also create racial disparity.
Overcrowding
Georgia’s facilities hold far more people than designed capacity:
- 200% capacity — nearly 50,000 inmates in facilities built for 25,000
- Triple bunking common in overcrowded units
- 58% more violent incidents in facilities above 120% capacity
- Only 15% of cells are single-occupancy
Georgia’s solution: a $437 million new prison instead of policy changes that would reduce the population.
What Drives Incarceration
Technical violations—not new crimes—fill Georgia’s prisons:
- 40% of prison admissions are probation violations
- 82% of parole returns are technical violations, not new crimes
- Average probation term: 6.3 years (other states: 2 years)
- 1 in 13 Georgia adults on probation or parole —highest rate in the nation
Miss an appointment or a payment, go to prison. Georgia criminalizes poverty.
Women’s Incarceration
Female incarceration has exploded:
- 7x increase in state prisons from 1978 to 2017
- 23x increase in county jails over the same period
- 80% are mothers to minor children
- No prison nursery programs in Georgia—mothers separated from newborns within days
Women face the same dangerous conditions as men—plus separation from their children.
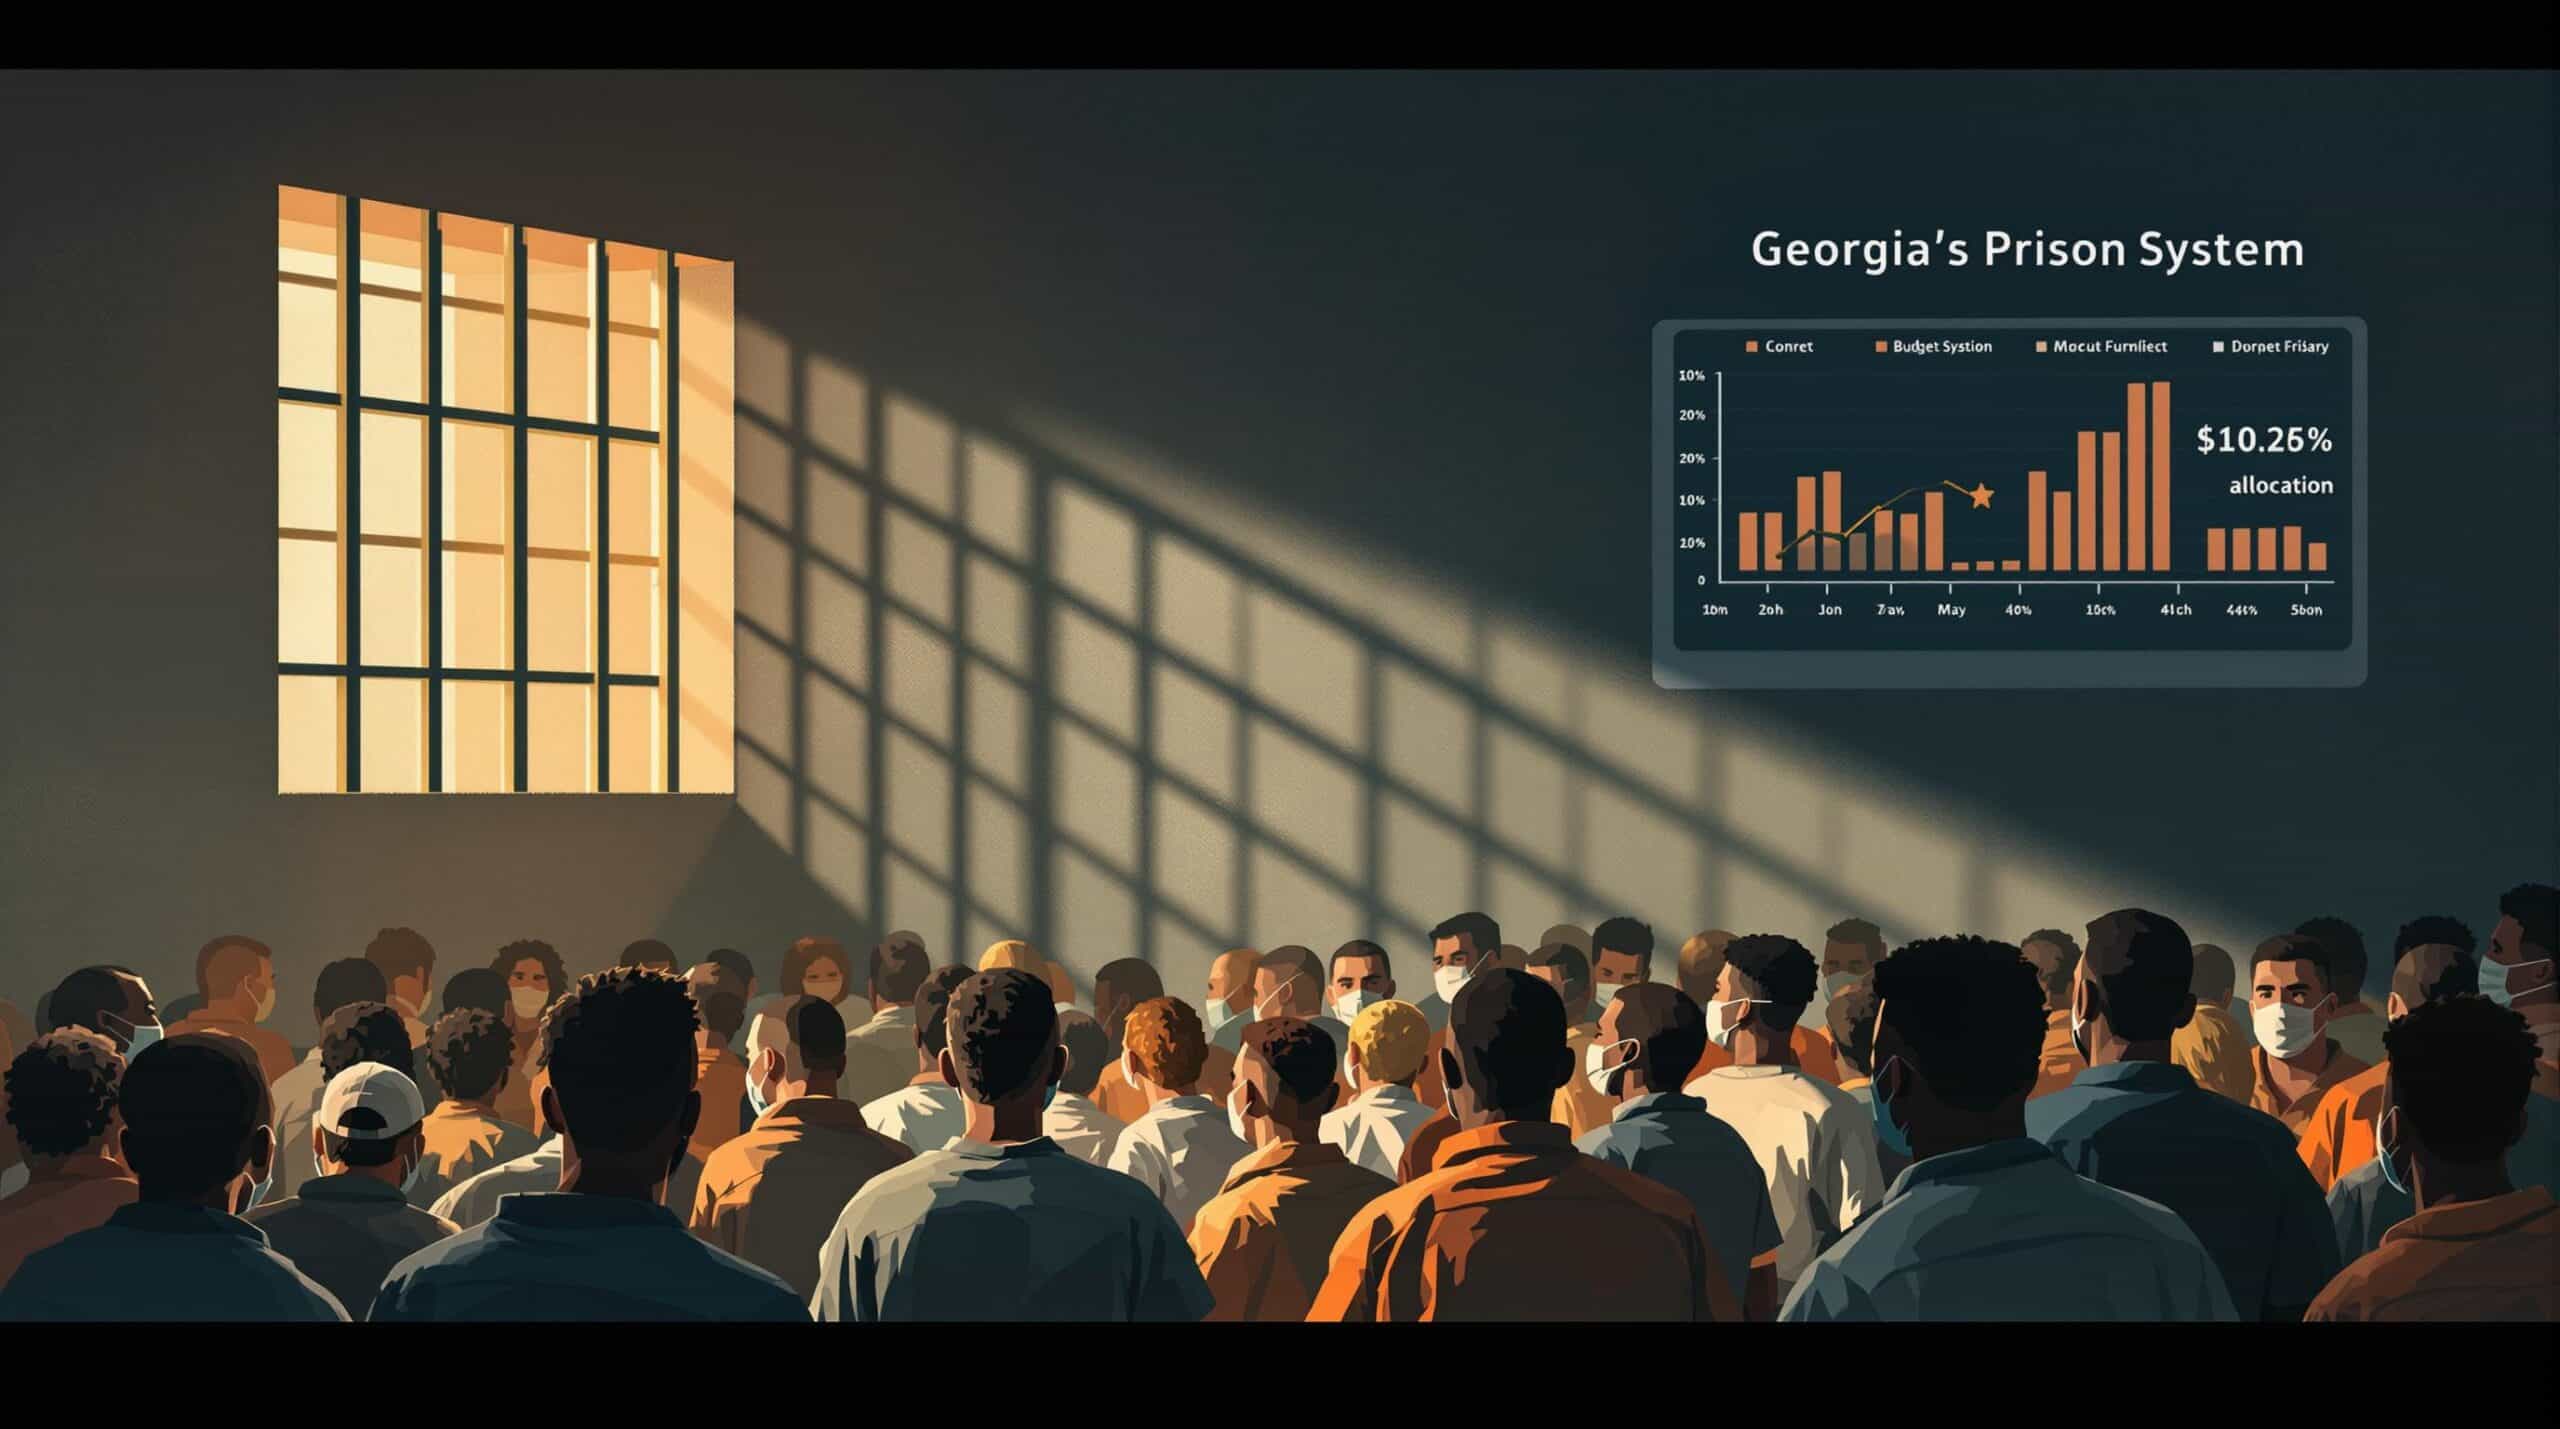
Budget Priorities
Where $1.72 billion goes:
- 70% to facility maintenance
- 30% to rehabilitation programs
- $270 million annually on healthcare for aging inmates (20% of population)
- Healthcare costs exceed the entire prison education budget
Georgia spends money warehousing people, not preparing them for release.
Youth in Adult System
Children prosecuted as adults face devastating outcomes:
- 75% of youth prosecuted as adults in Georgia are Black
- Higher rates of mental health issues than youth in juvenile system
- Higher recidivism rates than youth who remain in juvenile facilities
- No developmental programming designed for adolescent needs
Prosecuting children as adults doesn’t improve public safety. It destroys young lives.
Take Action
Use Impact Justice AI to send advocacy emails demanding criminal justice reform in Georgia. The free tool crafts personalized messages to Georgia lawmakers—no experience required.
Demand:
- End incarceration for technical probation violations
- Limit probation terms to 2 years for nonviolent offenses
- Address racial disparities in sentencing and enforcement
- Invest in rehabilitation over incarceration
Further Reading
- A Budgetary Black Hole: The True Cost of Neglecting Georgia’s Prisons
- $700 Million More—And Nothing to Show for It
- GPS Informational Resources
- Pathways to Success
About Georgia Prisoners’ Speak (GPS)
Georgia Prisoners’ Speak (GPS) is a nonprofit investigative newsroom built in partnership with incarcerated reporters, families, advocates, and data analysts. Operating independently from the Georgia Department of Corrections, GPS documents the truth the state refuses to acknowledge: extreme violence, fatal medical neglect, gang-controlled dorms, collapsed staffing, fraudulent reporting practices, and unconstitutional conditions across Georgia’s prisons.
Through confidential reporting channels, secure communication, evidence verification, public-records requests, legislative research, and professional investigative standards, GPS provides the transparency the system lacks. Our mission is to expose abuses, protect incarcerated people, support families, and push Georgia toward meaningful reform based on human rights, evidence, and public accountability.
Every article is part of a larger fight — to end the silence, reveal the truth, and demand justice.
- GPS Statistics, https://gps.press/gdc-statistics/[↩]