This explainer is based on Racial Disparities in Georgia’s Criminal Justice System. All statistics and findings are drawn directly from this source.
Executive Summary
Georgia spends over $5.3 billion annually on law enforcement and corrections while maintaining some of the nation’s most severe racial disparities at every stage of its criminal justice system. This research compilation from four leading research organizations documents how the state subjects Black Georgians to compounding, system-wide discrimination—from arrest through post-release supervision—while failing to invest in the behavioral health and community infrastructure that would actually improve public safety.
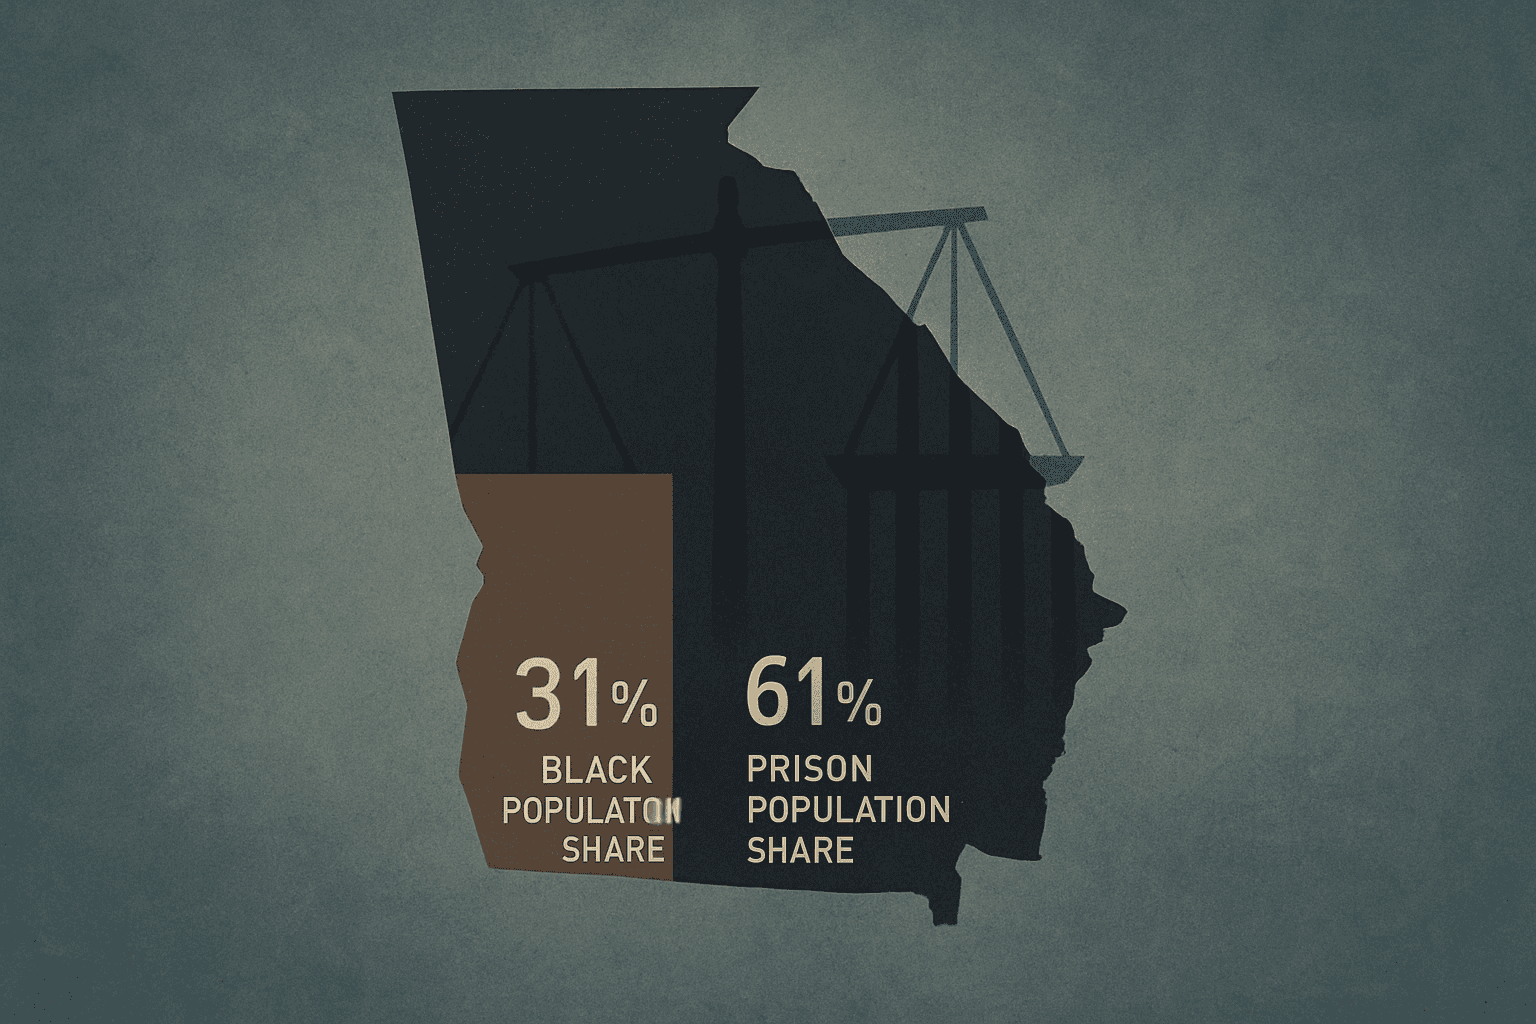
- Black Georgians constitute 31% of the state’s population but 61% of people in state prisons. The state incarcerates Black people at 2.7 times the rate of white people, and Georgia is among just 12 states where Black individuals make up more than half the prison population.
- Georgia holds 528,000 people under criminal justice supervision—95,000 behind bars and 356,000 on probation or parole—while maintaining the highest probation supervision rate in the entire country.
- The state’s parole board has cut releases by 34% and hearings by 44% since the pandemic, directly driving a 7% prison population increase between 2021–2023 that runs counter to national declines.
- 59% of people in Georgia jails have not been convicted of any crime, representing mass pretrial detention of legally innocent people.
- 1,219,000 Georgia adults needed but did not receive substance use treatment in 2021, while drug overdoses (2,752 deaths) far exceeded homicides (1,234 deaths)—yet the state continues to pour resources into incarceration rather than treatment.
Key Takeaway: Georgia spends $5.3 billion annually on law enforcement and corrections while Black Georgians—31% of the population—constitute 61% of the state prison population, and 1.2 million adults go without needed substance use treatment.
Fiscal Impact
Current Criminal Justice Spending
Georgia taxpayers bear enormous costs for a system that perpetuates racial inequality and fails to address the root causes of public safety challenges:
| Category | Annual Cost | Per Resident | Share of Budget |
|---|---|---|---|
| Law enforcement | $3,222,875,000 | $299 | 3.0% |
| Corrections | $2,120,035,000 | $197 | 2.0% |
| Combined total | $5,342,910,000 | $496 | 5.0% |
Rising Prison Costs Without Public Safety Returns
The state’s prison population increased 7% between 2021–2023, driven by the parole board’s decision to release 34% fewer people and conduct 44% fewer hearings since the pandemic. Each additional person held in prison represents ongoing costs for housing, healthcare, and staffing at a time when Georgia already struggles to hire and retain corrections officers.
The aging prison population compounds costs: 13% of people in Georgia’s prisons are over age 55, a cohort that requires significantly more expensive medical care. The state charges incarcerated people a $5.00 copay per healthcare visit—a fee that deters care-seeking and can lead to more expensive emergency interventions.
Misallocated Resources
Georgia’s spending priorities are misaligned with actual mortality risks. In 2022:
– 2,752 people died from drug overdoses
– 2,360 deaths were alcohol-induced
– 1,620 people died by suicide
– 1,234 people were victims of homicide
Yet 1,219,000 adults needed but did not receive substance use treatment in 2021. The state spends $5.3 billion on law enforcement and corrections while leaving a massive behavioral health treatment gap that feeds the cycle of incarceration.
Collateral Economic Costs
The state imposes 80% employment-related collateral consequences on people with convictions, with 45% being mandatory and 62% potentially indefinite in duration. These barriers lock people out of the workforce, reduce tax revenue, and increase the likelihood of reincarceration—71% of people released from prison in 2012 were arrested within 5 years.
Key Takeaway: Georgia spends $5.3 billion annually on law enforcement and corrections while drug overdoses kill more than twice as many people as homicides—and 1.2 million adults cannot access needed substance use treatment.
Key Findings
Racial Disparities Compound at Every System Touchpoint
The data reveals that Georgia’s criminal justice system subjects Black residents to escalating disadvantage at every stage. Compared to white adults, Black adults in Georgia are:
- 4.0 times more likely to be arrested
- 1.6 times more likely to be on probation
- 2.6 times more likely to be in prison
- 2.1 times more likely to be on parole
These disparities compound: a person who enters the system faces multiplying disadvantages at each subsequent decision point.
Enforcement Bias Beyond Crime Patterns
The gap between victimization and arrest rates suggests the state’s enforcement practices impose disparities beyond what crime patterns alone would explain. In 2022, the Black violent victimization rate was 3.2 times higher than the white rate—but Black people were arrested for violent crimes at a rate 3.9 times higher than white people. For property crimes, Black people were arrested at a rate 1.6 times higher than white people.
Mass Pretrial Detention
59% of people in Georgia jails are legally innocent—held before trial without a conviction. The state books more than 236,000 different people into local jails annually, cycling enormous numbers of people through a system that disrupts employment, housing, and family stability.
Youth Sentenced to Die in Prison
Georgia ranks 3rd nationally for young people serving life or virtual life sentences (50+ years). Approximately 900 youth are serving these sentences, with some individuals as young as 14 when charged. 80% of those serving life sentences for crimes committed as children are Black—a staggering disparity given that Black individuals represent approximately 32% of the state population.
Women’s Incarceration Has Exploded
The state has dramatically escalated its incarceration of women:
– Women’s jail population increased 1,107% since 1980 (from 227 in 1970 to 5,228 in 2015)
– Women’s prison population increased 600% since 1978 (from 497 to 3,779 in 2017)
These increases far exceed the growth rate for men, indicating gender-specific policy failures.
Rural Counties Bear Disproportionate Burden
Incarceration is not only an urban phenomenon. Rural counties demonstrate the highest per-capita incarceration rates—Irwin County had a jail admission rate of 125,429 per 100,000. The pretrial incarceration rate increased 33% in rural counties between 2000–2015, while decreasing 46% in the state’s urban county. This divergence suggests rural communities lack access to alternatives to incarceration.
The Parole Board Is Driving Prison Growth
The parole board’s post-pandemic contraction is a policy choice with direct consequences. In 2020, 46% of the total prison population—at least 11,827 people with sentences between 1 and 25 years—were eligible for parole. Yet only 44% of people leaving prison were granted conditional release, and 11% of people released from prison were released 3 years or more after their parole eligibility date. The board has since cut releases by 34% and hearings by 44%.
Georgia Leads the Nation in Probation
Georgia had the highest probation supervision rate in the country in 2021. Despite a 24% decrease since 2011, the state keeps 356,000 people on probation or parole—a population larger than the city of Savannah. Sixteen percent of prison admissions in 2021 were for parole violations, with 39% of those being technical violations—not new crimes.
Crime Is Down, But the State Keeps Locking People Up
Property crime decreased 51% between 2012 and 2022. The violent crime rate (367 per 100,000) is 4% lower than the national average. Georgia’s property crime rate (1,691 per 100,000) is 13% lower than the national average. Yet the prison population increased 7% between 2021–2023.
The State Fails to Solve Most Violent Crime
68% of violent crimes in Georgia were not solved in 2022, 6 percentage points worse than the national average. Rape was the violent crime least frequently solved, with 80% of incidents reported to police not solved. The state prioritizes incarceration over investigation and resolution of actual harm.
Key Takeaway: Black Georgians face compounding disparities at every system stage—4.0x more likely to be arrested, 2.6x more likely imprisoned—while the state fails to solve 68% of violent crimes.
Comparable States
Regional Context
The source data provides limited direct state-to-state comparisons but offers the following regional and national benchmarks:
- Georgia is among 12 states where Black individuals make up more than half the prison population, despite Black residents constituting only 31% of the population.
- Georgia had the highest probation supervision rate in the country in 2021, even after a 24% reduction since 2011.
- Georgia had the 23rd-highest parole supervision rate in the country in 2021.
- Georgia’s property crime rate (1,691 per 100,000) was 13% lower than the national average (1,954 per 100,000) in 2022.
- Georgia’s violent crime rate (367 per 100,000) was 4% lower than the national average (381 per 100,000) in 2022.
- Georgia’s unsolved violent crime rate (68%) was 6 percentage points worse than the national average (62%) in 2022.
National Racial Disparity Trends
Nationally, the prison incarceration rate for Black people remains 5.2 times higher than for white people, while Georgia’s rate is 2.7 times higher (though this figure measures prison only, not total system involvement). Nationally, the Black-white jail disparity is 3.1 times; the Black-white parole disparity is 3.2 times.
National Recidivism
Of people released from prison nationally in 2012, 71% were arrested within 5 years, 54% were convicted of a new offense, and 46% returned to prison. Georgia-specific prison reincarceration data is not available in the source documents.
Note: Comprehensive state-by-state racial disparity comparisons for all system touchpoints are not available in the source documents.
Key Takeaway: Georgia leads the nation in probation rates and ranks among just 12 states where Black people constitute more than half the prison population, while its violent crime rate is actually below the national average.
Policy Recommendations
Based on the evidence compiled in this research, the following policy actions would address documented disparities and reduce unnecessary expenditures:
1. Mandate Racial Impact Statements for All Criminal Justice Legislation
Require that every bill affecting criminal penalties, sentencing, or law enforcement practices include an analysis of projected racial impact, modeled on fiscal impact statements. The compounding disparities documented at every system stage—from arrest (4.0x) through parole (2.1x)—demand proactive assessment before new policies are enacted.
2. Reform the Parole Board’s Operations and Transparency
Require the State Board of Pardons and Paroles to restore hearing rates to pre-pandemic levels and publicly report data on grant rates by race, offense type, and time past eligibility. With 46% of the prison population parole-eligible and the board conducting 44% fewer hearings, legislative oversight is essential to prevent arbitrary restrictions on release.
3. Eliminate Cash Bail for Misdemeanors and Low-Level Felonies
With 59% of people in Georgia jails held without conviction, the General Assembly should establish a presumption of release for non-violent charges and require individualized risk assessments. This would reduce jail populations, save county governments money, and address the disproportionate pretrial detention of Black Georgians (51% of jail populations vs. 32% of the state population).
4. Invest in Community Behavioral Health Infrastructure
Redirect a portion of the $2.1 billion annual corrections expenditure toward closing the treatment gap for the 1,219,000 adults who needed but did not receive substance use treatment in 2021. Drug overdoses (2,752 deaths) killed more than twice as many Georgians as homicides (1,234 deaths) in 2022. Fentanyl deaths increased 5.7 times between 2015 and 2022.
5. Limit Technical Violation Reincarceration
Prohibit reincarceration for technical parole and probation violations except when public safety is demonstrably at risk. In 2021, 39% of parole violation prison admissions were for technical violations—not new crimes. Combined with Georgia’s status as the nation’s highest probation supervision rate, this practice needlessly fills prison beds.
6. Review and Sunset Employment-Related Collateral Consequences
Conduct a comprehensive review of Georgia’s collateral consequences regime, where 80% are employment-related, 45% are mandatory, and 62% are potentially indefinite. Establish sunset provisions and require demonstrated public safety justification for each consequence. Employment barriers directly increase recidivism risk.
7. End Life Without Parole for Juvenile Offenses and Create Review Mechanisms
With approximately 900 youth serving life or virtual life sentences—80% of whom are Black—establish a mandatory sentence review mechanism after 15–20 years for all individuals sentenced for crimes committed before age 18. Georgia ranks 3rd nationally in youth life sentences.
8. Require County-Level Incarceration Data Reporting
Mandate standardized reporting of jail admissions, pretrial detention rates, and racial demographics for all 159 counties. Rural counties show dramatically different trends than urban areas—pretrial detention increased 33% in rural counties while decreasing 46% in the urban county—but inconsistent data collection obscures the full picture.
9. Establish an Independent Corrections Oversight Body
Create a legislatively authorized oversight board with subpoena power to monitor conditions, staffing, healthcare access, and racial disparities across all state correctional facilities. The current system spends $197 per resident on corrections without adequate independent accountability mechanisms.
Key Takeaway: Nine specific legislative actions—from racial impact statements to parole reform to behavioral health investment—can address documented disparities while reducing the $5.3 billion annual cost of the current system.
Read the Source Document
This analysis draws on data from the Prison Policy Initiative (2024–2025), Vera Institute of Justice (2019), Council of State Governments Justice Center (December 2023), and The Sentencing Project (2023–2025).
Other Versions
- Public Version — A plain-language summary for community members, families, and advocacy organizations
- Media Version — Key findings formatted for journalists and editorial boards
Sources & References
- CSG Justice Center: Supervision Violations and Their Impact on Incarceration. Council of State Governments Justice Center (2024-01-01) Official Report
- The Sentencing Project: Racial Disparities Data. The Sentencing Project (2024-01-01) Official Report
- Council of State Governments Justice Center: Georgia Criminal Justice Data Snapshot — Matt Herman, Amund Tallaksen, Myles Moore, Madeleine Dardeau. Council of State Governments Justice Center (2023-12-01) Official Report
- CSG: Georgia Criminal Justice Data Snapshot — Matt Herman, Amund Tallaksen, Myles Moore, Madeleine Dardeau. Council of State Governments Justice Center (2023-12-01) Official Report
- AH Datalytics YTD Murder Comparison. AH Datalytics (2023-11-13) Data Portal
- Bureau of Labor Statistics Local Area Unemployment Statistics (LAUS). Bureau of Labor Statistics (2023-01-01) Data Portal
- HRSA National Center for Health Workforce Analysis. Health Resources & Services Administration (2023-01-01) Data Portal
- National Inventory of Collateral Consequences of Conviction. National Reentry Resource Center (2023-01-01) Data Portal
- BJS National Crime Victimization Survey. Bureau of Justice Statistics (2022-01-01) Data Portal
- BLS Occupational Employment and Wage Statistics. Bureau of Labor Statistics (2022-01-01) Data Portal
- CDC National Center for Health Statistics. Centers for Disease Control and Prevention (2022-01-01) Data Portal
- FBI Uniform Crime Reporting Program NIBRS. Federal Bureau of Investigation / Bureau of Justice Statistics (2022-01-01) Data Portal
- FBI Uniform Crime Reporting Program SRS. Federal Bureau of Investigation (2022-01-01) Data Portal
- HUD Annual Homelessness Assessment Report. U.S. Department of Housing and Urban Development (2022-01-01) Official Report
- Murder Accountability Project. Murder Accountability Project (2022-01-01) Data Portal
- SAMHSA Treatment Episode Data Set. Substance Abuse and Mental Health Services Administration (2022-01-01) Data Portal
- U.S. Census Bureau American Community Survey. U.S. Census Bureau (2022-01-01) Data Portal
- U.S. Census Bureau Annual Survey of State and Local Government Finances. U.S. Census Bureau (2022-01-01) Data Portal
- BJS Annual Survey of Jails. Bureau of Justice Statistics (2021-01-01) Data Portal
- BJS Prisoners in the United States. Bureau of Justice Statistics (2021-01-01) Official Report
- BJS Probation and Parole in the United States. Bureau of Justice Statistics (2021-01-01) Official Report
- Michigan Department of Health and Human Services: Age-Adjusted Homicide Death Rates by Race and Sex 1980-2021. Michigan Department of Health and Human Services (2021-01-01) Data Portal
- SAMHSA National Survey on Drug Use and Health. Substance Abuse and Mental Health Services Administration (2021-01-01) Data Portal
- BJS National Corrections Reporting Program. Bureau of Justice Statistics (2020-01-01) Data Portal
- Council on Criminal Justice: Tracking the Size of America’s Criminal Justice System. Council on Criminal Justice (2020-01-01) Data Portal
- Vera Institute of Justice: Incarceration Trends in Georgia — Christian Henrichson, Eital Schattner-Elmaleh, Jacob Kang-Brown, Oliver Hinds, James Wallace-Lee. Vera Institute of Justice (2019-12-01) Official Report
- BJS Recidivism of Prisoners Released in 34 States in 2012. Bureau of Justice Statistics (2012-01-01) Official Report
- Arnold Ventures (funder acknowledgment for Vera Institute report). Arnold Ventures Press Release
- Bureau of Justice Assistance Grant No. 2019-ZB-BX-K002 (CSG Justice Center funding). Bureau of Justice Assistance, U.S. Department of Justice Official Report
- Bureau of Justice Statistics Census of Jails. Bureau of Justice Statistics Data Portal
- Bureau of Justice Statistics Jail Inmates Series. Bureau of Justice Statistics Data Portal
- Georgia Department of Corrections Statistical Trends Reports. Georgia Department of Corrections Data Portal
- Jacob Kaplan – Cleaned FBI Offenses Known and Clearances by Arrest Dataset — Jacob Kaplan Data Portal
- Prison Policy Initiative, Georgia Profile. Prison Policy Initiative Data Portal
- Prison Policy Initiative: Georgia State Profile (2024-2025). Prison Policy Initiative Official Report
Source Document
You just read about people suffering in state custody. The least you can do is make sure other people read it too. Share this story.
1 thought on “Racial Disparities Across Georgia’s Criminal Justice System: A $5.3 Billion Accountability Gap”