This explainer is based on Racial Disparities in Georgia’s Criminal Justice System. All statistics and findings are drawn directly from this source.
News Lead
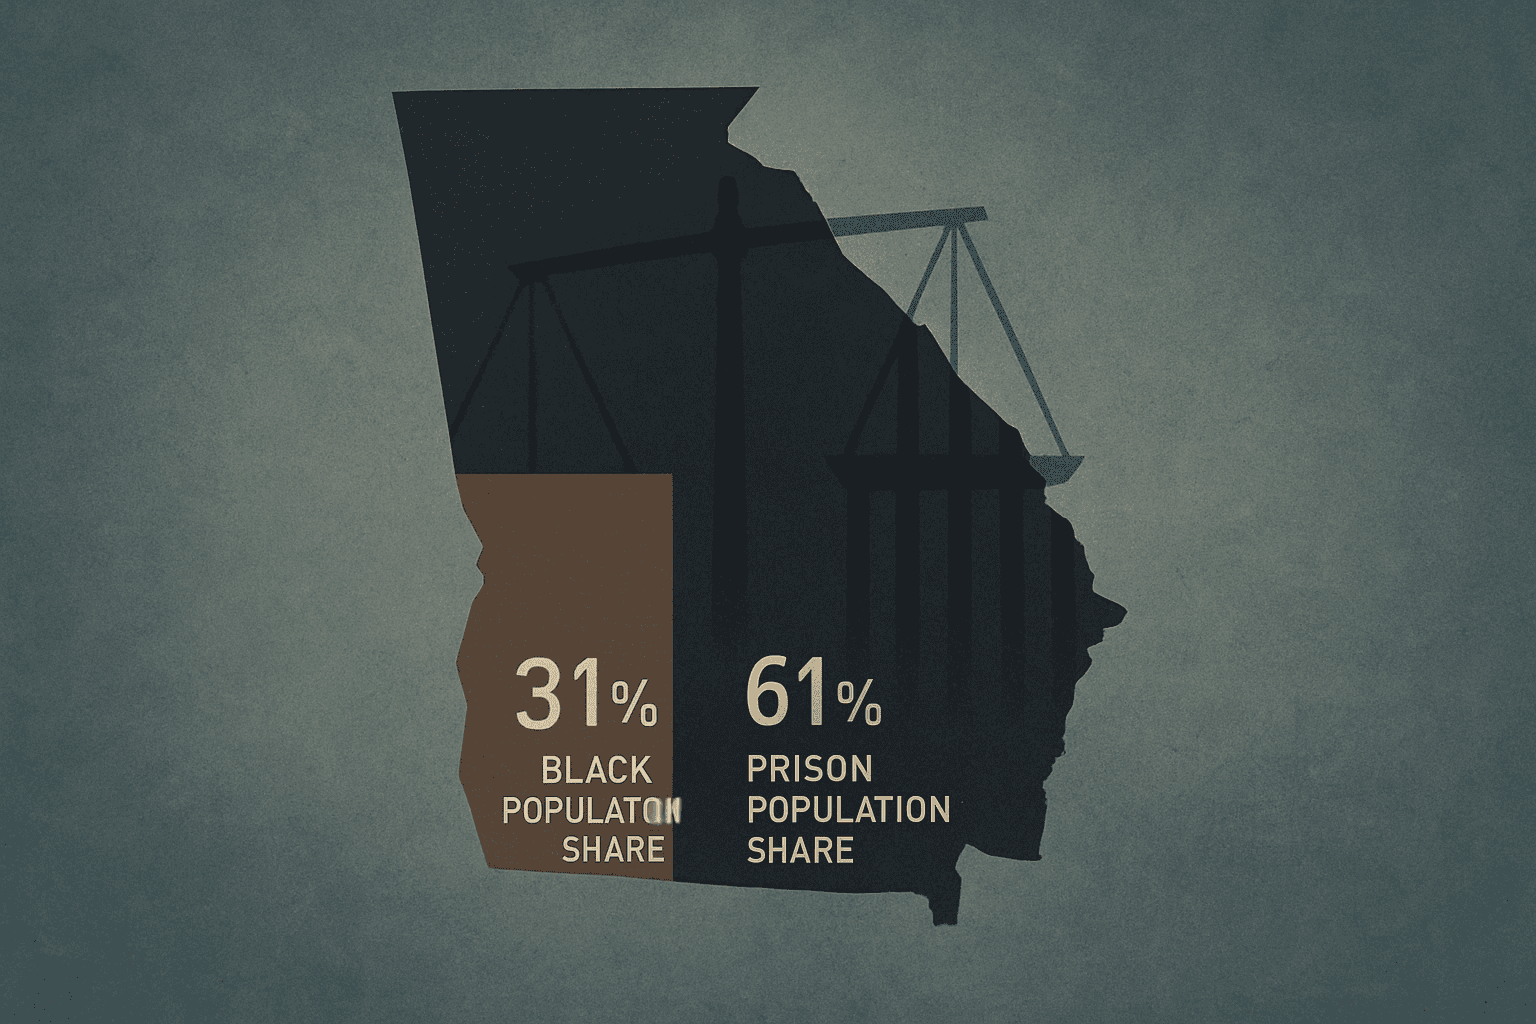
A comprehensive research compilation drawing on data from the Prison Policy Initiative, Vera Institute of Justice, Council of State Governments Justice Center, and The Sentencing Project reveals that Georgia’s criminal justice system subjects Black residents to compounding racial disparities at every stage — from arrest through post-release supervision. While Black individuals make up 31% of Georgia’s population, they constitute 61% of the state prison population and 51% of the jail population. Black adults in Georgia are 4.0 times more likely to be arrested, 2.6 times more likely to be in prison, and 2.1 times more likely to be on parole than white adults.
The data exposes a gap between victimization and enforcement that suggests bias beyond crime occurrence: Black Georgians experience violent victimization at 3.2 times the rate of white Georgians, yet are arrested for violent crimes at 3.9 times the rate — a disparity that cannot be explained by crime patterns alone. Among Georgia’s most vulnerable population, 80% of youth serving life or virtual life sentences for crimes committed as children are Black.
Meanwhile, the state’s overall incarceration apparatus continues to expand. Georgia’s prison population grew 7% between 2021 and 2023 even as national trends moved in the opposite direction. The state’s parole board has released 34% fewer people since the pandemic while conducting 44% fewer hearings — decisions that keep people locked up longer and drive population growth. Georgia currently holds 95,000 people behind bars and keeps 528,000 residents under some form of criminal justice supervision.
Key Takeaway: Black Georgians make up 31% of the state’s population but 61% of its prison population, with compounding racial disparities documented at every stage of the criminal justice system.
Quotable Statistics
Racial Disparities — The Numbers
– Black individuals are 61% of Georgia’s state prison population while representing 31% of the state’s population
– Black individuals are 51% of Georgia’s jail population while representing 32% of state residents
– Black adults are 4.0x more likely to be arrested than white adults
– Black adults are 2.6x more likely to be in prison than white adults
– Black adults are 1.6x more likely to be on probation than white adults
– Black adults are 2.1x more likely to be on parole than white adults
– Black people are incarcerated in state prisons at 2.7x the rate of white people
– 80% of youth serving life sentences for crimes committed as children are Black
– Black violent victimization rate is 3.2x higher than white rate, but Black violent crime arrest rate is 3.9x higher — a gap suggesting enforcement bias
Scale of Incarceration
– 95,000 people currently behind bars in Georgia
– 528,000 Georgia residents under criminal justice supervision
– 356,000 people on probation or parole
– 236,000+ different people booked into local jails annually
– Incarceration rate: 881 per 100,000 residents
– 59% of people in Georgia jails are legally innocent — held pretrial without conviction
System Trends
– Prison population increased 7% between 2021–2023
– Parole board released 34% fewer people since the pandemic
– Parole board conducted 44% fewer hearings since the pandemic
– Georgia has the highest probation supervision rate in the entire country
– ~900 youth serving life with parole or virtual life sentences (50+ years); Georgia ranks 3rd nationally
Women’s Incarceration
– Women’s jail population increased 1,107% since 1980
– Women’s prison population increased 600% since 1978
Spending
– Georgia spent $3,222,875,000 on law enforcement in 2021
– Georgia spent $2,120,035,000 on corrections in 2021
– Combined: more than $5.3 billion annually on law enforcement and corrections
Unmet Needs
– 1,219,000 adults in Georgia needed but did not receive substance use treatment in 2021
– 1,872,000 adults experienced mental illness in 2021
– Drug overdoses killed 2,752 people in 2022 — more than double the 1,234 homicide deaths
Key Takeaway: Racial disparities compound at every stage: Black Georgians are 4.0x more likely to be arrested, 2.6x more likely to be imprisoned, and 2.1x more likely to be on parole than white Georgians.
Context and Background
This research compilation synthesizes data from four authoritative sources — the Prison Policy Initiative, Vera Institute of Justice, Council of State Governments Justice Center, and The Sentencing Project — covering the period from 2023 to 2025, with underlying data ranging from the 1970s to 2023.
What reporters should know:
The disparity compounds. The data shows racial disparities are not confined to a single decision point. They begin at arrest (4.0x), persist through pretrial detention (51% of jail population is Black), continue through imprisonment (61% of prison population is Black, incarcerated at 2.7x the rate), extend to community supervision (1.6x on probation, 2.1x on parole), and reach their most extreme expression in juvenile life sentencing (80% Black). Each stage of the system amplifies the disparity introduced at earlier stages.
The enforcement-victimization gap matters. One of the compilation’s most significant findings is that Black Georgians are arrested for violent crimes at 3.9 times the rate of white Georgians, while experiencing violent victimization at only 3.2 times the rate. This gap suggests that enforcement practices — not crime patterns alone — drive part of the disparity.
Georgia is moving against the national trend. While many states reduced their prison populations in recent years, Georgia’s grew 7% between 2021 and 2023. The parole board’s decision to hold 44% fewer hearings and release 34% fewer people directly contributes to this growth. At the same time, 59% of people in Georgia jails have not been convicted of any crime.
Georgia leads the nation in probation. Despite a 24% decrease since 2011, Georgia still has the highest probation supervision rate in the country. Combined with 80% of collateral consequences being employment-related and 62% potentially indefinite in duration, the system creates lasting barriers even after people complete their sentences.
The behavioral health treatment gap is enormous. With 1,219,000 adults needing but not receiving substance use treatment and 1,872,000 experiencing mental illness, the criminal justice system functions as a default response to public health crises. Drug overdoses (2,752 deaths) and alcohol-induced deaths (2,360) each far exceeded homicides (1,234) in 2022.
Rural incarceration is surging. Pretrial incarceration rates increased 33% in rural counties between 2000 and 2015, while decreasing 46% in urban counties. Irwin County had the highest jail admission rate at 125,429 per 100,000.
249,000 Georgians should have their voting rights restored, according to The Sentencing Project.
Key Takeaway: Georgia’s criminal justice system is expanding against national trends, with compounding racial disparities, a massive behavioral health treatment gap, and the nation’s highest probation rate creating overlapping crises.
Story Angles
1. “The Parole Bottleneck: How Georgia’s Board Is Driving Prison Growth”
Georgia’s prison population grew 7% between 2021 and 2023 while the parole board held 44% fewer hearings and released 34% fewer people. In 2020, 46% of the prison population — at least 11,827 people — were eligible for parole, and 11% of those released had waited 3 or more years past their eligibility date. This angle investigates how parole board decisions are the primary driver of Georgia’s growing prison population, who sits on the board, and what accountability mechanisms exist.
2. “Arrested More Than Victimized: The Enforcement Gap That Reveals Racial Bias in Georgia Policing”
Black Georgians experience violent victimization at 3.2 times the rate of white Georgians — but are arrested for violent crimes at 3.9 times the rate. That gap between victimization and arrest rates points to enforcement practices that go beyond responding to crime. Combined with the fact that Black people make up 61% of the prison population while being 31% of the state population, this angle examines how policing decisions — not crime rates — produce racial disparities.
3. “Children Sentenced to Die in Prison: Georgia’s 900 Youth Serving Life Sentences”
Georgia ranks 3rd nationally for youth serving life or virtual life sentences (50+ years), with approximately 900 young people affected — some charged as young as 14. Eighty percent of them are Black. This angle profiles the human cost of juvenile life sentencing, examines how Georgia compares to states that have reformed these practices, and investigates what legal and legislative remedies are available.
Read the Source Document
Download the full research compilation (PDF) — “Racial Disparities in Georgia’s Criminal Justice System: Research Compilation”
Other Versions
- Public Version — A plain-language summary for community members and advocates
- Legislator Version — A policy-focused brief with reform recommendations for Georgia lawmakers
Sources & References
- CSG Justice Center: Supervision Violations and Their Impact on Incarceration. Council of State Governments Justice Center (2024-01-01) Official Report
- The Sentencing Project: Racial Disparities Data. The Sentencing Project (2024-01-01) Official Report
- Council of State Governments Justice Center: Georgia Criminal Justice Data Snapshot — Matt Herman, Amund Tallaksen, Myles Moore, Madeleine Dardeau. Council of State Governments Justice Center (2023-12-01) Official Report
- CSG: Georgia Criminal Justice Data Snapshot — Matt Herman, Amund Tallaksen, Myles Moore, Madeleine Dardeau. Council of State Governments Justice Center (2023-12-01) Official Report
- AH Datalytics YTD Murder Comparison. AH Datalytics (2023-11-13) Data Portal
- Bureau of Labor Statistics Local Area Unemployment Statistics (LAUS). Bureau of Labor Statistics (2023-01-01) Data Portal
- HRSA National Center for Health Workforce Analysis. Health Resources & Services Administration (2023-01-01) Data Portal
- National Inventory of Collateral Consequences of Conviction. National Reentry Resource Center (2023-01-01) Data Portal
- BJS National Crime Victimization Survey. Bureau of Justice Statistics (2022-01-01) Data Portal
- BLS Occupational Employment and Wage Statistics. Bureau of Labor Statistics (2022-01-01) Data Portal
- CDC National Center for Health Statistics. Centers for Disease Control and Prevention (2022-01-01) Data Portal
- FBI Uniform Crime Reporting Program NIBRS. Federal Bureau of Investigation / Bureau of Justice Statistics (2022-01-01) Data Portal
- FBI Uniform Crime Reporting Program SRS. Federal Bureau of Investigation (2022-01-01) Data Portal
- HUD Annual Homelessness Assessment Report. U.S. Department of Housing and Urban Development (2022-01-01) Official Report
- Murder Accountability Project. Murder Accountability Project (2022-01-01) Data Portal
- SAMHSA Treatment Episode Data Set. Substance Abuse and Mental Health Services Administration (2022-01-01) Data Portal
- U.S. Census Bureau American Community Survey. U.S. Census Bureau (2022-01-01) Data Portal
- U.S. Census Bureau Annual Survey of State and Local Government Finances. U.S. Census Bureau (2022-01-01) Data Portal
- BJS Annual Survey of Jails. Bureau of Justice Statistics (2021-01-01) Data Portal
- BJS Prisoners in the United States. Bureau of Justice Statistics (2021-01-01) Official Report
- BJS Probation and Parole in the United States. Bureau of Justice Statistics (2021-01-01) Official Report
- Michigan Department of Health and Human Services: Age-Adjusted Homicide Death Rates by Race and Sex 1980-2021. Michigan Department of Health and Human Services (2021-01-01) Data Portal
- SAMHSA National Survey on Drug Use and Health. Substance Abuse and Mental Health Services Administration (2021-01-01) Data Portal
- BJS National Corrections Reporting Program. Bureau of Justice Statistics (2020-01-01) Data Portal
- Council on Criminal Justice: Tracking the Size of America’s Criminal Justice System. Council on Criminal Justice (2020-01-01) Data Portal
- Vera Institute of Justice: Incarceration Trends in Georgia — Christian Henrichson, Eital Schattner-Elmaleh, Jacob Kang-Brown, Oliver Hinds, James Wallace-Lee. Vera Institute of Justice (2019-12-01) Official Report
- BJS Recidivism of Prisoners Released in 34 States in 2012. Bureau of Justice Statistics (2012-01-01) Official Report
- Arnold Ventures (funder acknowledgment for Vera Institute report). Arnold Ventures Press Release
- Bureau of Justice Assistance Grant No. 2019-ZB-BX-K002 (CSG Justice Center funding). Bureau of Justice Assistance, U.S. Department of Justice Official Report
- Bureau of Justice Statistics Census of Jails. Bureau of Justice Statistics Data Portal
- Bureau of Justice Statistics Jail Inmates Series. Bureau of Justice Statistics Data Portal
- Georgia Department of Corrections Statistical Trends Reports. Georgia Department of Corrections Data Portal
- Jacob Kaplan – Cleaned FBI Offenses Known and Clearances by Arrest Dataset — Jacob Kaplan Data Portal
- Prison Policy Initiative, Georgia Profile. Prison Policy Initiative Data Portal
- Prison Policy Initiative: Georgia State Profile (2024-2025). Prison Policy Initiative Official Report
Source Document
You just read about people suffering in state custody. The least you can do is make sure other people read it too. Share this story.