Georgia built prisons for 24,657. They warehouse 52,923.
Across four decades, the Georgia Department of Corrections kept adding people to the same buildings. In most medium-security cellhouses, single-man cells were triple-bunked on the bottom tier and double-bunked on the top. The dorms tripled in population. Medical, kitchens, libraries, and counseling stayed the same size. This is the warehouse — and rehabilitation isn’t on the list of what’s possible inside it.
Original design capacity is published only for Georgia’s 34 state and private prisons — 24,657 beds in total. The apples-to-apples comparison against that capacity is the 43,236 people currently held in those same 34 facilities. The remaining 9,687 people under GDC supervision — in transitional centers, county correctional institutions, RSAT, and probation detention — have no published design-capacity figures, and bring the headline total to 52,923 (live, GDC Friday Statistics).
“To protect Georgians by operating secure facilities and providing opportunities for offender rehabilitation.”
— gdc.georgia.gov, agency mission statement
Two obligations. Secure facilities — the U.S. Department of Justice has already found Georgia in violation on that one. The architecture documented below shows why the second obligation — rehabilitation — is physically impossible to deliver inside the buildings GDC currently operates. The buildings are the receipt. GDC made a promise it cannot keep with the facilities it has.
Georgia doesn’t run a corrections system. It runs a warehouse.
The numbers above are the architecture. These are the human consequences of cramming 44,540 people into buildings designed for 24,849.
Fewer staff per inmate, less rehabilitation per dollar, more violence per capita — than at any point in GDC’s history. Read the full case at gps.press/end-the-warehouse/ →
Every line is a person added to a building that didn’t grow.
Georgia’s documented original design capacity, year by year, vs. the actual incarcerated population — through today’s live count. The blue line is the floor (many older facilities lack published design figures, so it’s a conservative under-count). The red line is what the state actually crammed in; the gold dot at the right edge is this week’s live total from the GDC Friday Statistics. The design line stays flat after 2020 because no new state prisons have been built since.
Population line: GDC’s published “Year-end counts 1925–present” for 1980-2024; the gold dot is this week’s GDC Friday Statistics.
The gap shown is a conservative floor — full source list in The Receipts below.
More inmates. Same kitchen. Same medical. Same library.
These prisons were architecturally sized to feed, treat, teach, counsel, and watch the number of people they were built for. When the population doubled or tripled, the support infrastructure didn’t. Bigger dorms didn’t come with a bigger clinic. A facility designed for 500 men now holding 1,750 — the live reality at most cohort-1 and cohort-2 prisons — still operates with the same kitchen line, the same pharmacy window, the same handful of programming rooms, the same single library, the same physical-plant chokepoints. Every one of those single-point bottlenecks now serves twice or three times the people it was designed for — and the consequences are exactly what you’d predict.
- Opening-day staff positions (verified)From FY1989-FY1992 OPB budgets — per-facility staffing approved at opening:Telfair: 327Hancock: 279Hays: 399Ware: 285Johnson: 320Mitchell: 320
~1 staff per 2.5 inmates designed. Today these prisons hold 1,100–1,800 each — and they’re operating with a fraction of even their original staff complement. The U.S. Department of Justice’s October 2024 Findings Report documented GDC correctional-officer vacancy rates of 49.3% (2021), 56.3% (2022), and 52.5% (2023) systemwide, peaking at 60% in April 2023. As of December 2023, 18 GDC prisons had CO vacancy rates above 60%, and 10 of those exceeded 70%.
- Medical care infrastructureOriginal architectural infirmaries were sized for 500–750 inmates per facility. Many of these prisons now hold 1,500–1,800 — and the same single pharmacy window, the same medical wing, and the same handful of nursing stations serve them all. From GPS’s published investigation Death by Neglect: Georgia’s Prison Medical Care Crisis: “Prisoners regularly wait months, sometimes years, for essential medical treatment… Due to overcrowding and understaffing, medical appointments are frequently canceled or postponed indefinitely. It is common practice for inmates to be turned away from medical offices even when experiencing severe symptoms.”• EMS access delays: DOJ found that emergency-medical-services teams responding to GDC prisons waited an average of 30 minutes for security staff to open the three gates required to reach the medical unit.• Bodies discovered in rigor mortis: GDC records on four deaths in 2021 describe bodies that were not found until rigor had set in — meaning hours had passed since death before any check.• Trauma-cost feedback loop: In a state-court lawsuit against GDC, the agency’s own former medical contractor alleged that GDC’s failure to control violence drove extraordinarily high trauma-care costs (DOJ Findings Report, p. 78).• Prescription failures: Family attestations received by GPS report prescription medications — including mental-health medications — at Augusta State Medical Prison routinely going unfilled for one to two months at a time.• Chronic-care denial (pending litigation): A wrongful-death suit filed by the family of Almir Harris, a Type 1 diabetic, alleges GDC and its private medical contractor refused to provide insulin for several months before his death.
- Mental-health support bedsThe agency’s FY2019 Annual Report documented 1,350 supportive-living-unit (SLU) beds across 14 facilities for the GDC’s roughly 10,500 mental-health-diagnosed offenders. That’s one SLU bed for every eight mental-health inmates — and the SLU bed count has not grown meaningfully since.
- Suicide-watch & crisis mental-health capacityGDC’s own September 2023 Agency Overview to the State Board of Corrections acknowledged 40 suicides and 38 homicides in custody in FY2023 — cited in the U.S. Department of Justice’s October 2024 Findings Report on Georgia prisons (p. 75). The same DOJ investigation found facility-level suicide-watch protocols routinely overridden by housing-shortage pressures.
- Kitchens & food serviceA 500-bed prototype came with a 500-bed kitchen line, a 500-bed walk-in cooler, and a kitchen-staff complement approved at opening. Putting 1,500 people into the same building doesn’t enlarge the steam table or expand the food-service workforce. GPS has published three separate investigations on what the bottleneck has produced:• Contaminated trays, ~60¢ per meal: 30-year-old dishwashing machines (many broken), forcing kitchen workers to hand-dunk trays in chemical barrels with no heat cycle. Johnson State Prison scored 64/100 (failing) on its Dec 2023 food-safety inspection with 5 cooking ovens, 1 tilting skillet, 1 cooking kettle, 1 griddle, 1 freezer, and 1 bulk ice machine all broken at once. Pulaski State Prison’s Jan 2026 inspection found sewage backing up through the kitchen floor drains (repeat violation) and the only handwashing sink ripped from the wall. Smith State Prison has had rodent activity flagged as a repeat violation every inspection 2022–2025 with no resolution.• ~$2/day food budget, 1,200 calories/day: Georgia spends $1.77–$2.20 per prisoner per day on food (USDA’s minimum for adult male nutrition is roughly $10). Inmates report losing 30–50 pounds in six months; some report eating toothpaste to calm hunger pangs. Food superintendents reportedly receive bonuses for staying under budget by “shaking the spoon” — serving smaller portions. Nutritional analysis: roughly 40% of required protein and 1 serving of vegetables/day (USDA: 3–5).• Ten-year inmate testimony: “For about a year now, the hamburger meat has had bone shards in it so sharp you could get seriously injured eating it. Everyone has stab wounds in their gums and between their teeth. People quit eating it… so [GDC] fixed the meat grinder to grind the bones up more. That was the fix.”• Medical-diet failures (recent GPS-source reports, GDCP): 2,800-calorie medical-profile trays for diabetics refused at meal service; documented peanut-allergy alternative meals refused because the resident was “not on the kitchen’s list”; all kitchen ice machines simultaneously broken (May 2026); skipped bedtime snacks for medical-diet residents.
When a single kitchen has to feed three times as many people in the same 90-minute window, throughput dictates that “nutrition” becomes whatever fits through the line — not what the medical profile requires, and not what a human body needs.
- Dining-hall capacityOriginal prototypes seated roughly one full housing-unit dorm at a time. With dorms now holding 80–160 people instead of the designed-for 48–64, GPS-source reports describe inmates eating standing up, eating in shifts, or eating cold food after the cohort ahead of them has run the steam table down. The architecture of the dining hall hasn’t changed — the demand on it has doubled or tripled.
- Library, law library & programming — the rehabilitation infrastructure GDC promisedThis is where the second half of the mission statement breaks. Original architectural designs included a single library, a single law library, and a small number of program/counseling rooms per facility — each sized for the original capacity. When the buildings filled past design, that infrastructure didn’t scale. Documented impacts:• Anonymous testimony to GPS describes a few weeks of weekly law-library access followed by months with no access at all.• Inmates at one facility reported being completely denied law-library access for two and a half years.• The DOJ Findings Report documents that at multiple facilities, programming, rehabilitation, and gang-intervention efforts are not provided because security staff are too short to supervise them (p. 80).• Family attestations to GPS describe incarcerated people choosing the danger of general population over protective custody specifically to access programming required for release — because the PC blocks they would otherwise be assigned to have none.
Ten Georgia prisons operate above 200% of original design.
Sorted by overcrowding factor (current population ÷ original design capacity). In Brown v. Plata (2011), the U.S. Supreme Court ordered California to release 46,000 prisoners because its system operated at 200%. Every facility in this table exceeds that threshold.
| Facility | Design | Population | % of Design | Deaths since 2020 |
|---|---|---|---|---|
| Georgia Diagnostic (GDCP) | 500 | 2,485 | 497% | 118 |
| Dodge State Prison | 404 | 1,329 | 329% | 16 |
| Phillips State Prison | 230 | 673 | 293% | 68 |
| Ware State Prison | 500 | 1,447 | 289% | 84 |
| Telfair State Prison | 480 | 1,188 | 248% | 56 |
| Wilcox State Prison | 750 | 1,845 | 246% | 46 |
| Hays State Prison | 448 | 1,092 | 244% | 35 |
| Rogers State Prison | 596 | 1,410 | 237% | 14 |
| Pulaski State Prison | 500 | 1,186 | 237% | 29 |
| Macon State Prison | 750 | 1,770 | 236% | 88 |
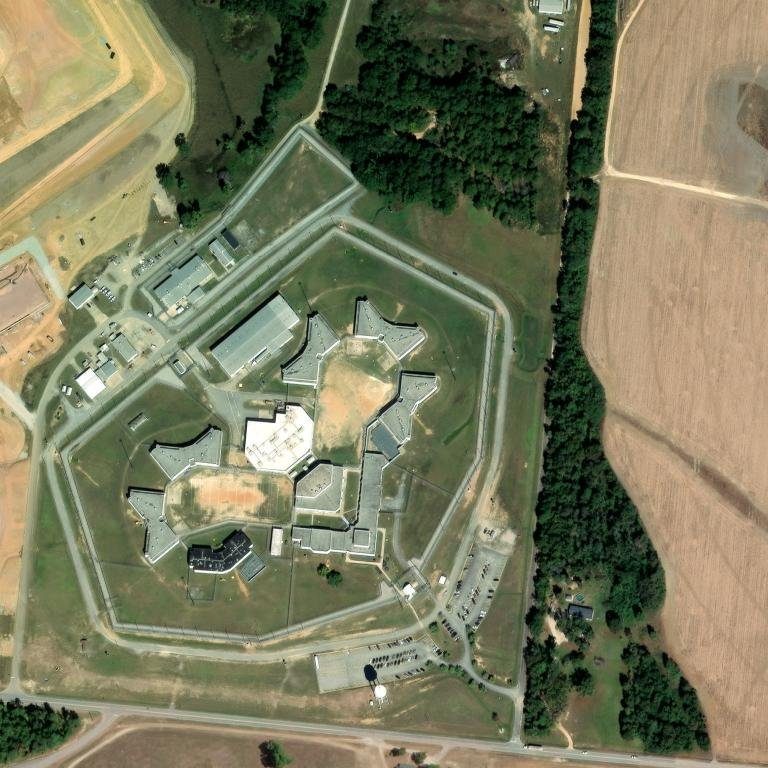
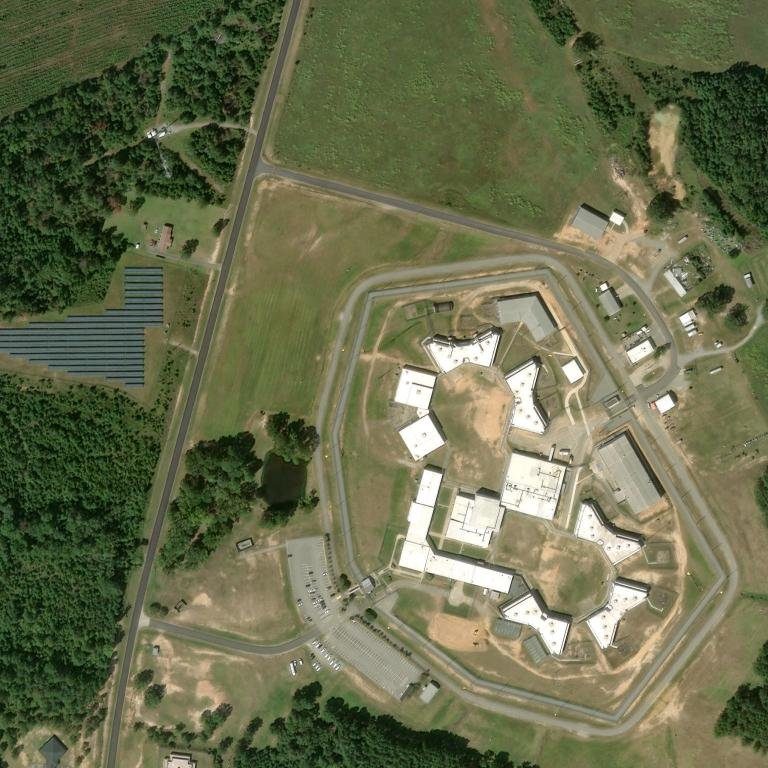
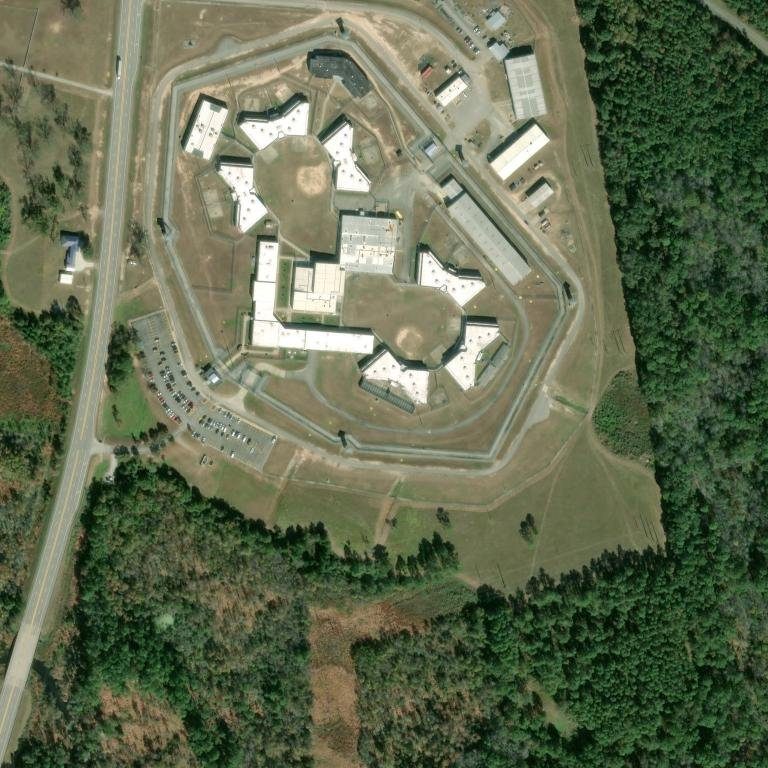
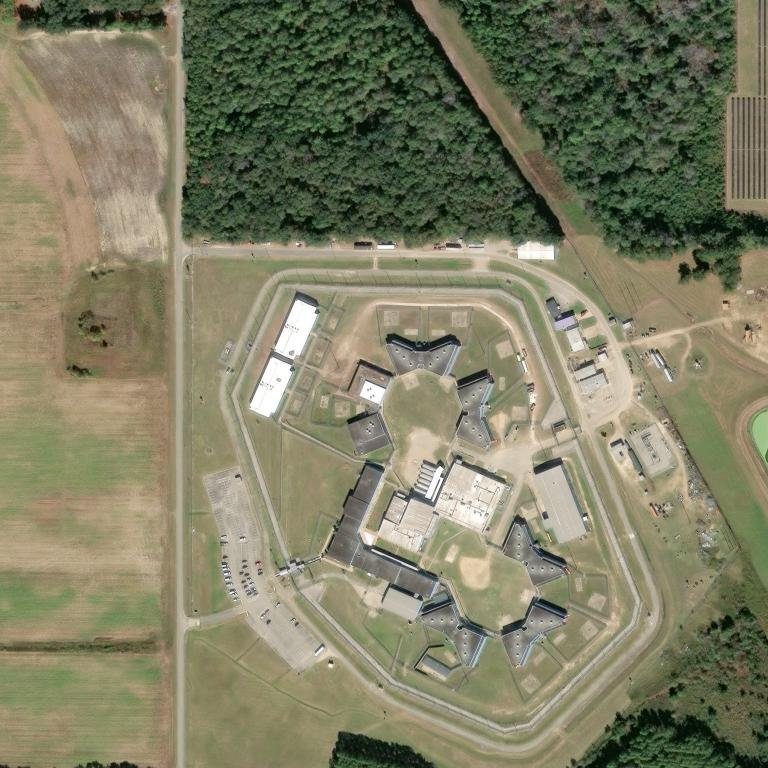
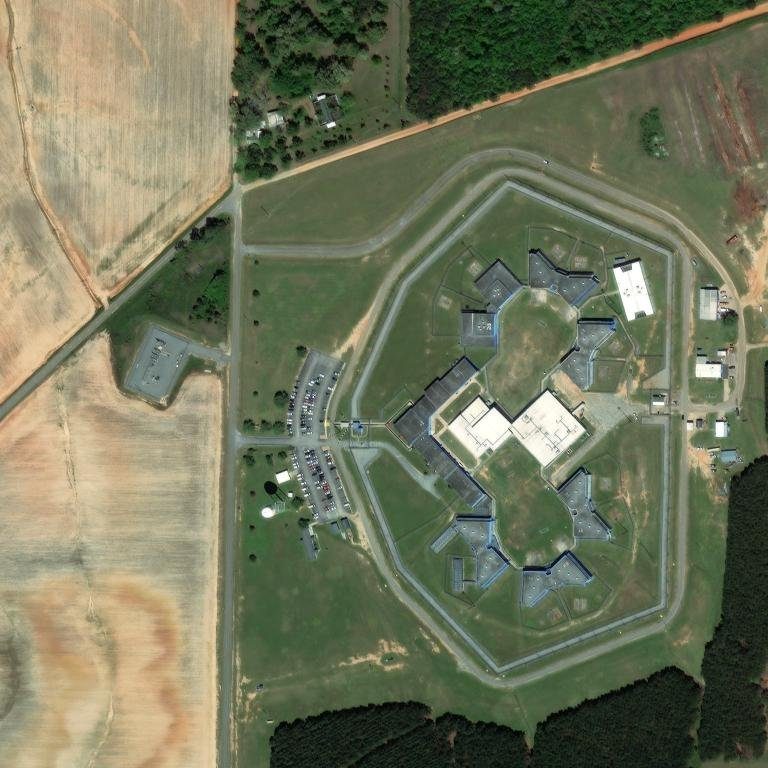
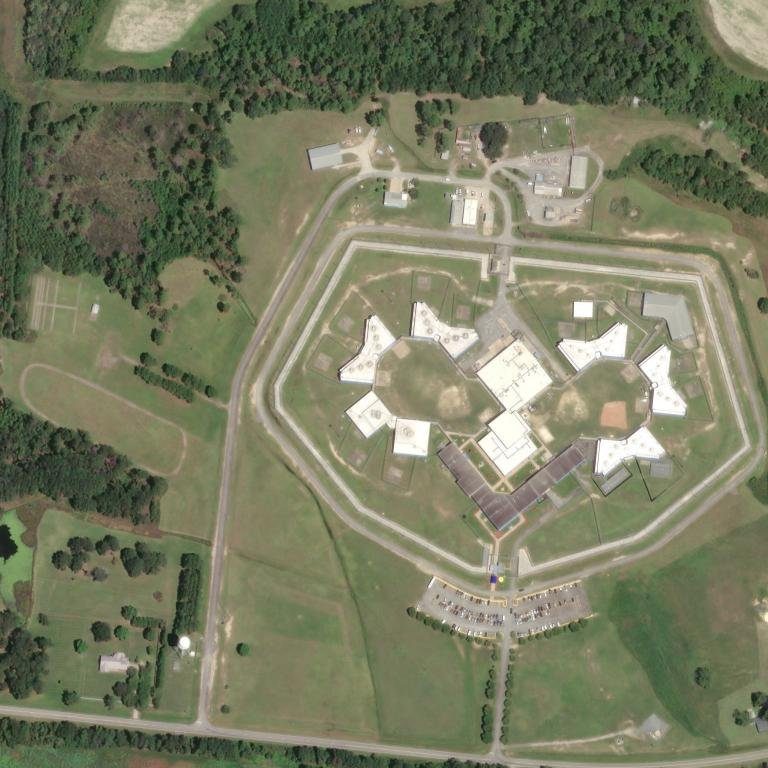
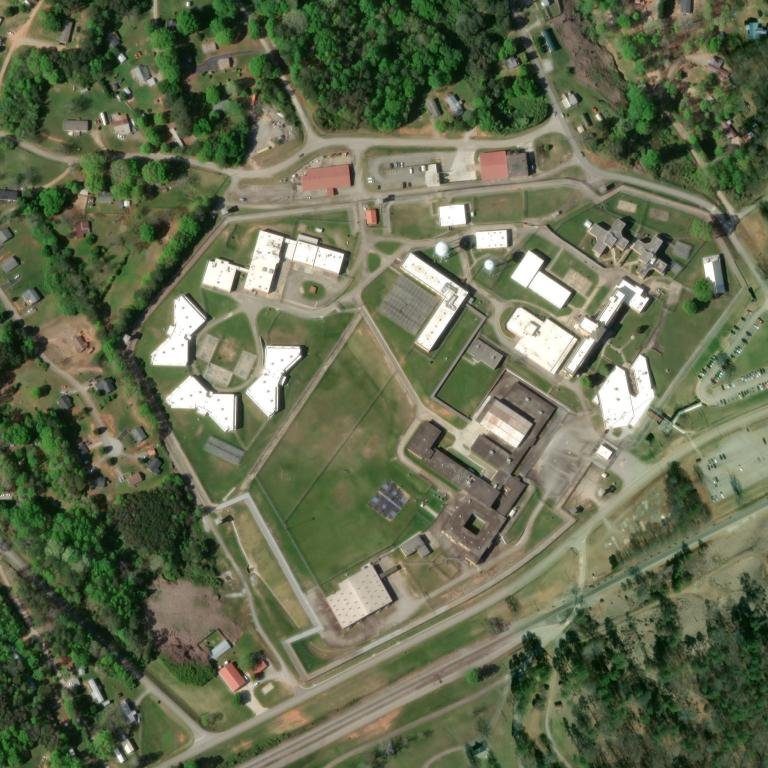
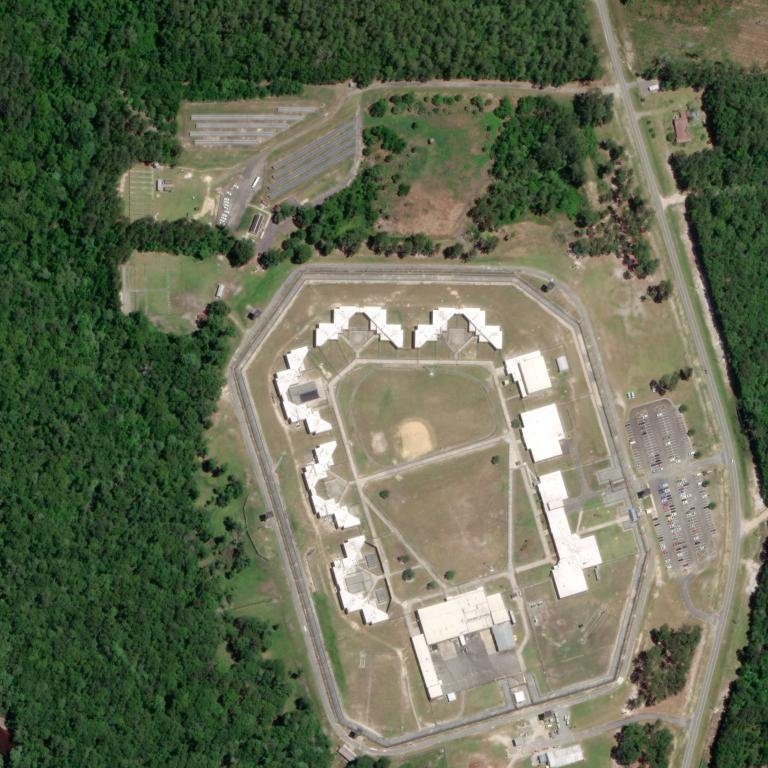
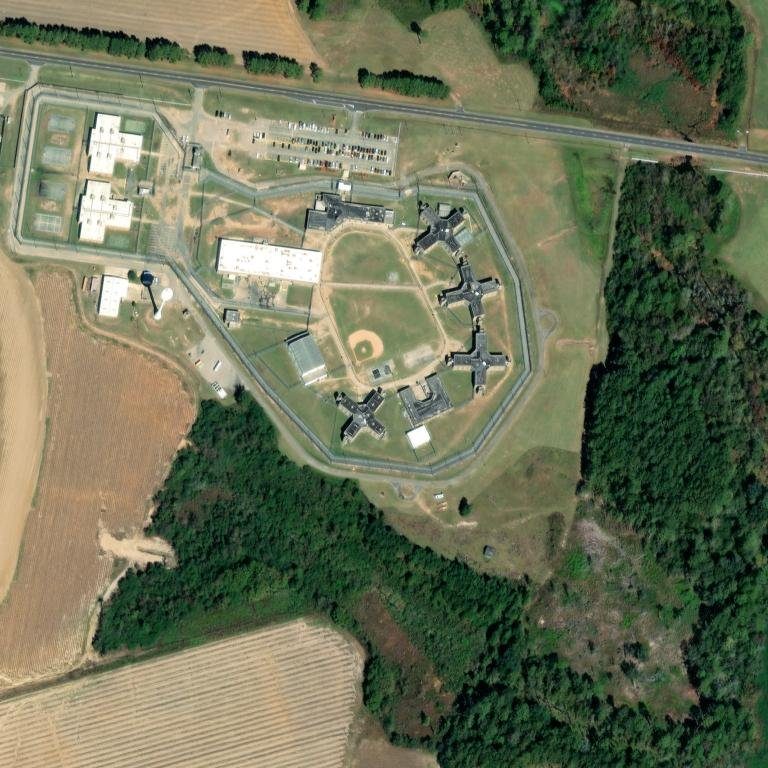
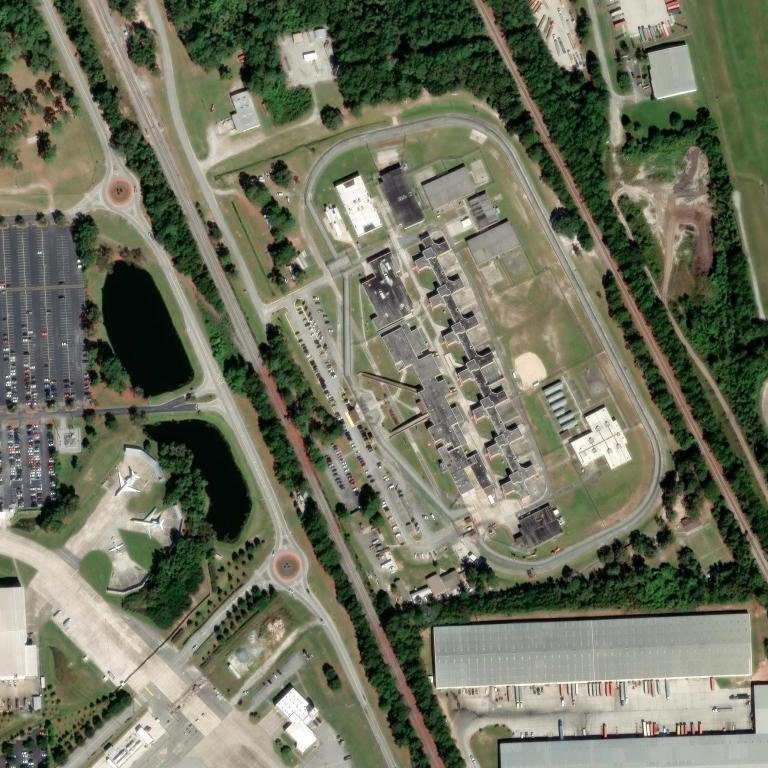
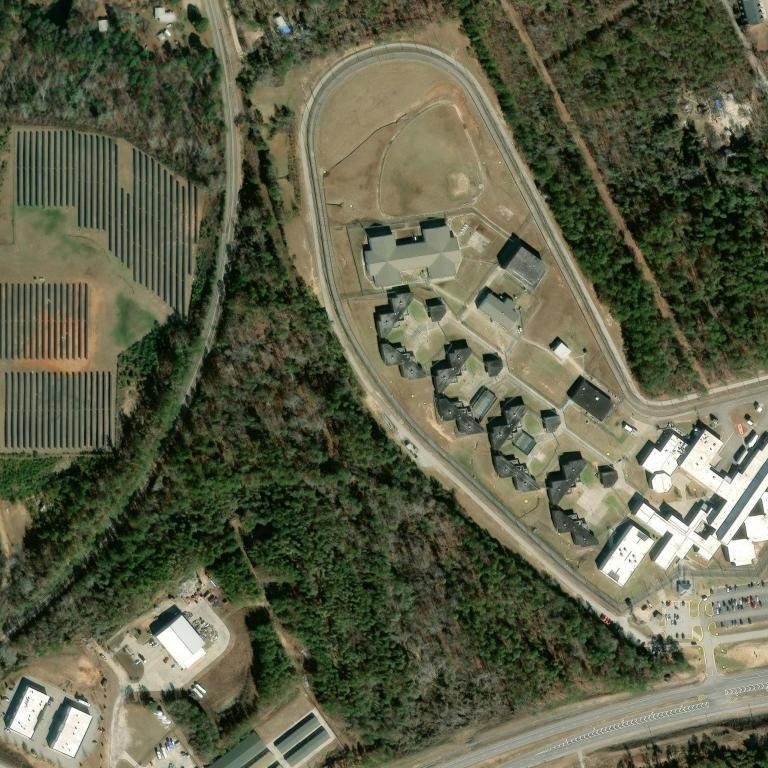
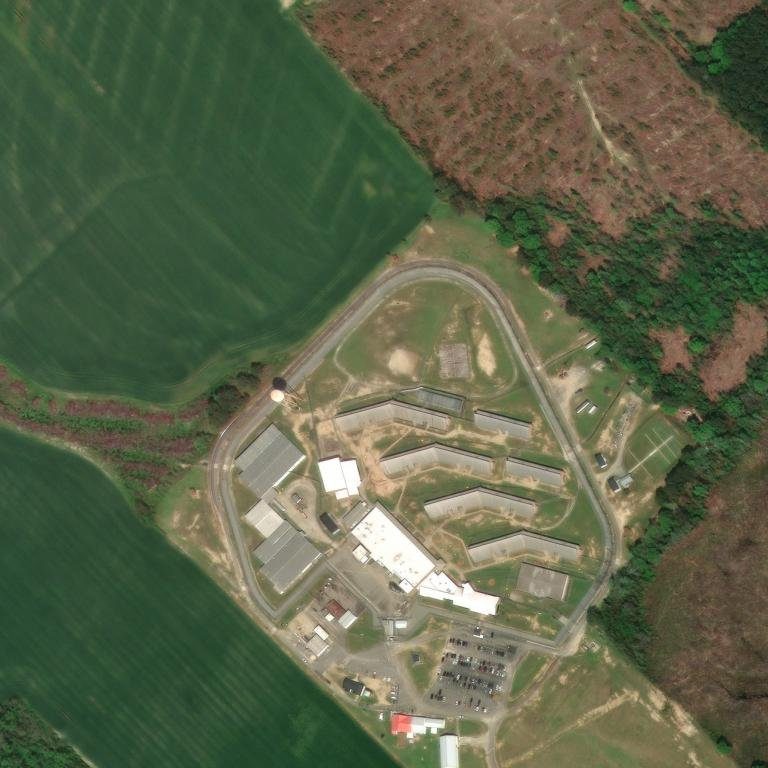
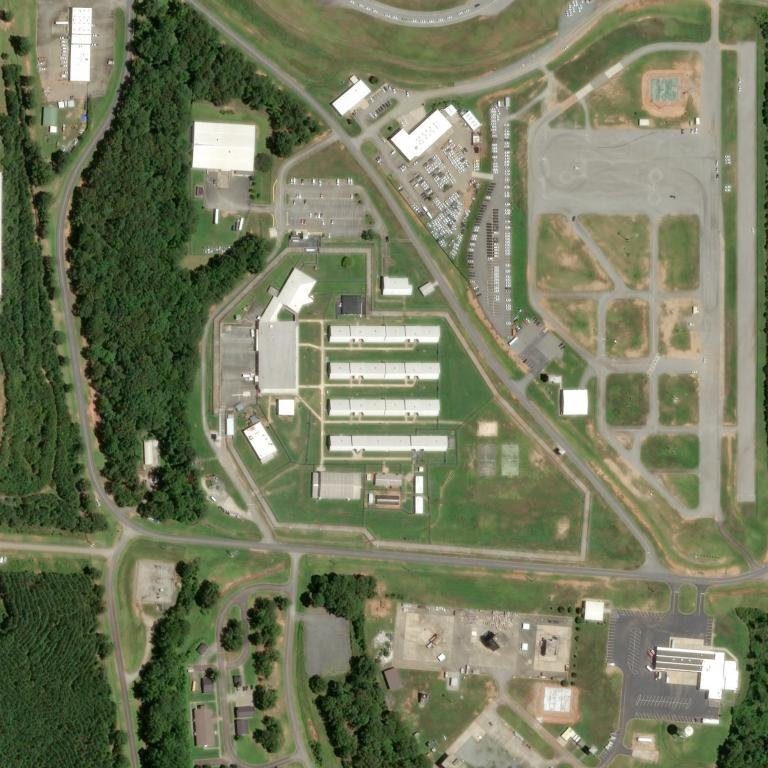
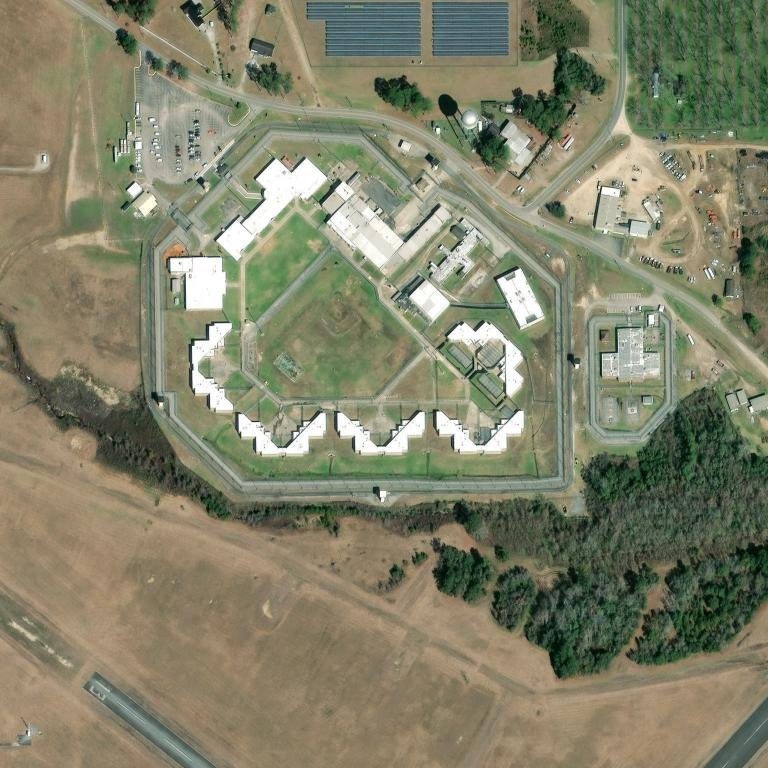
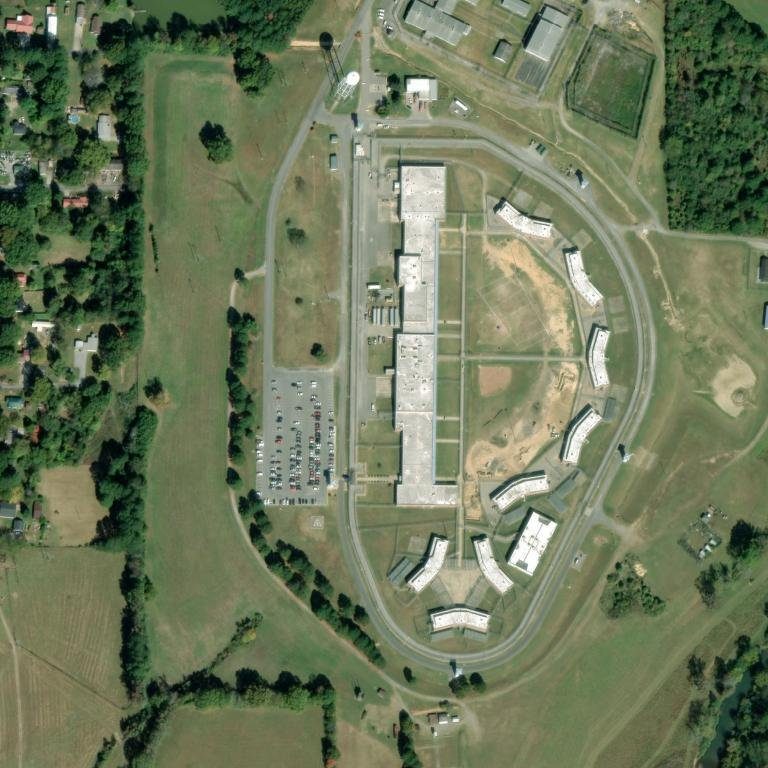
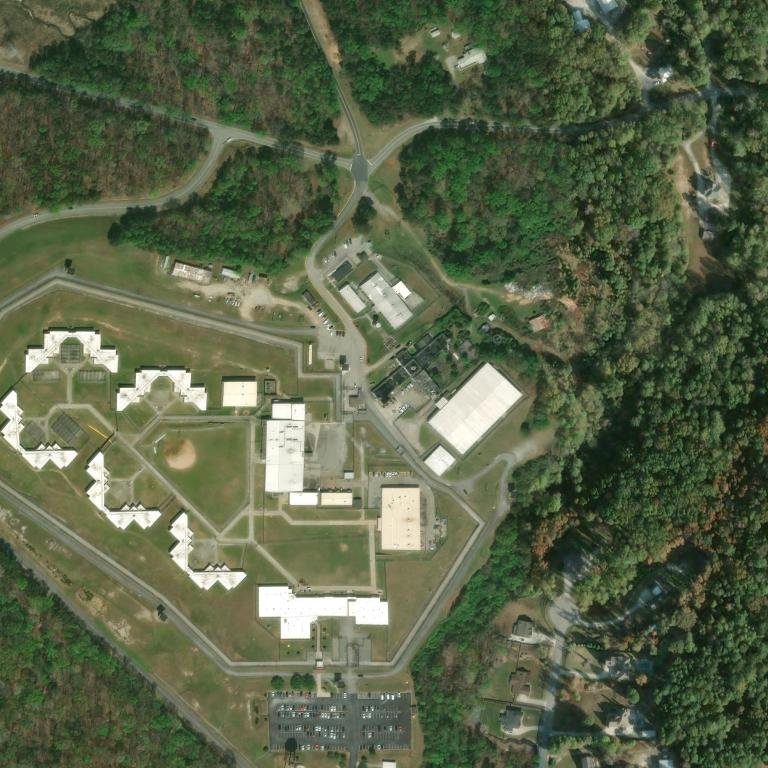
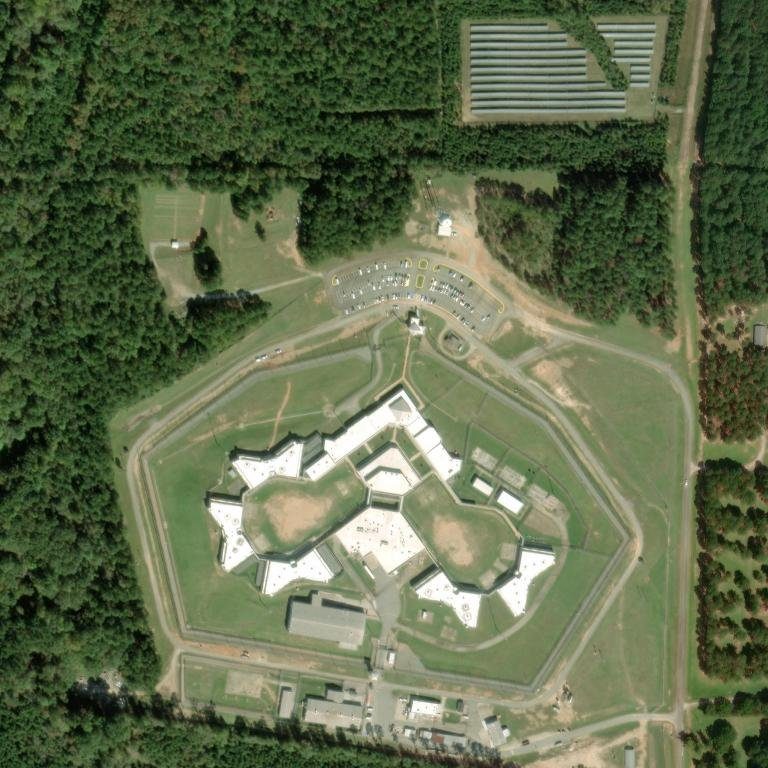
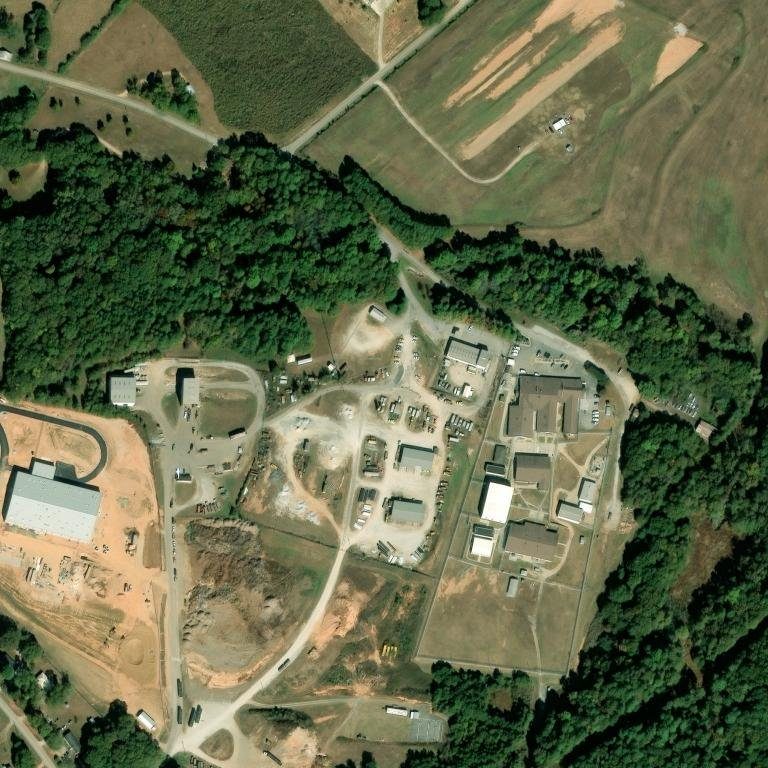
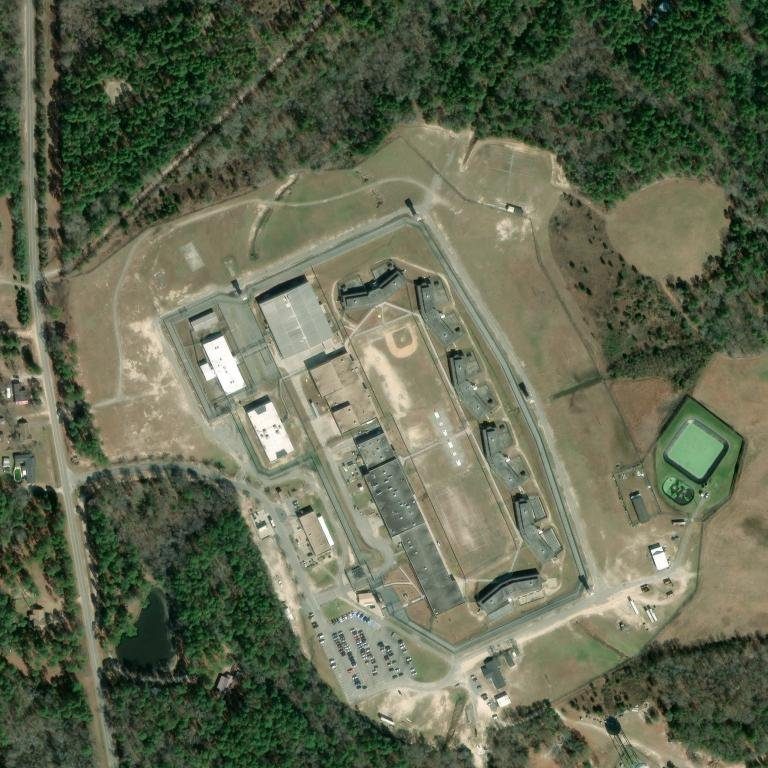
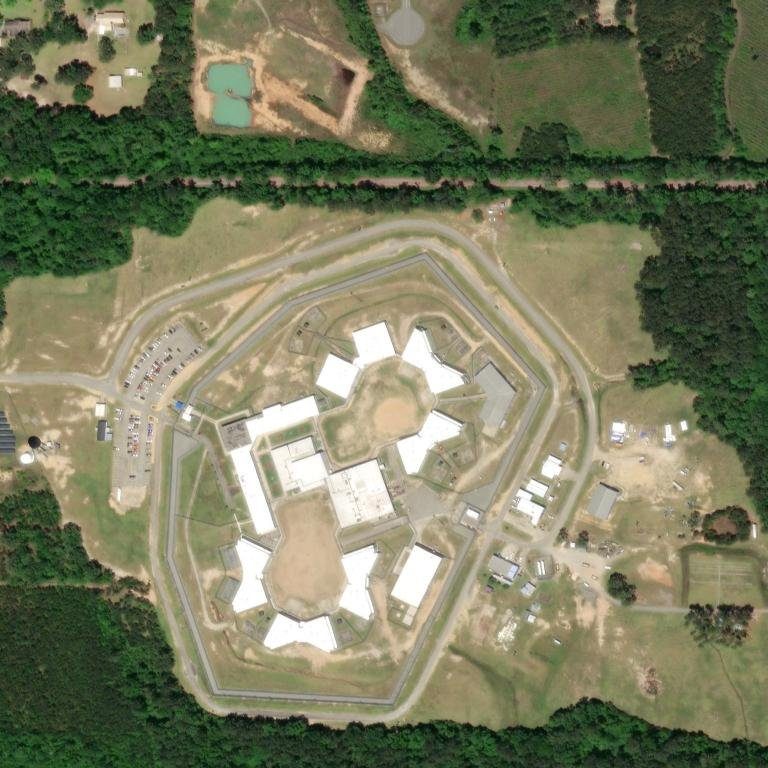
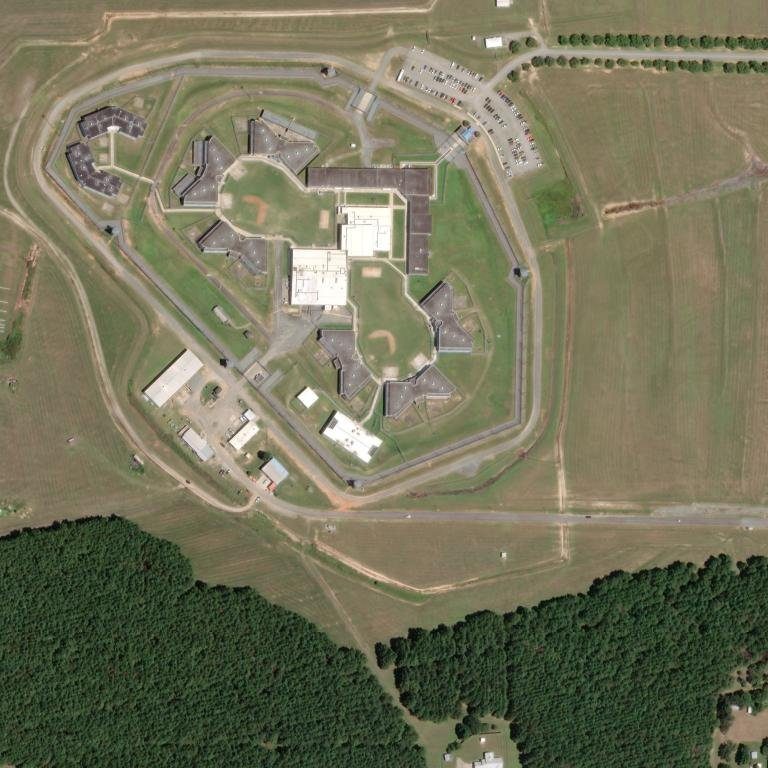
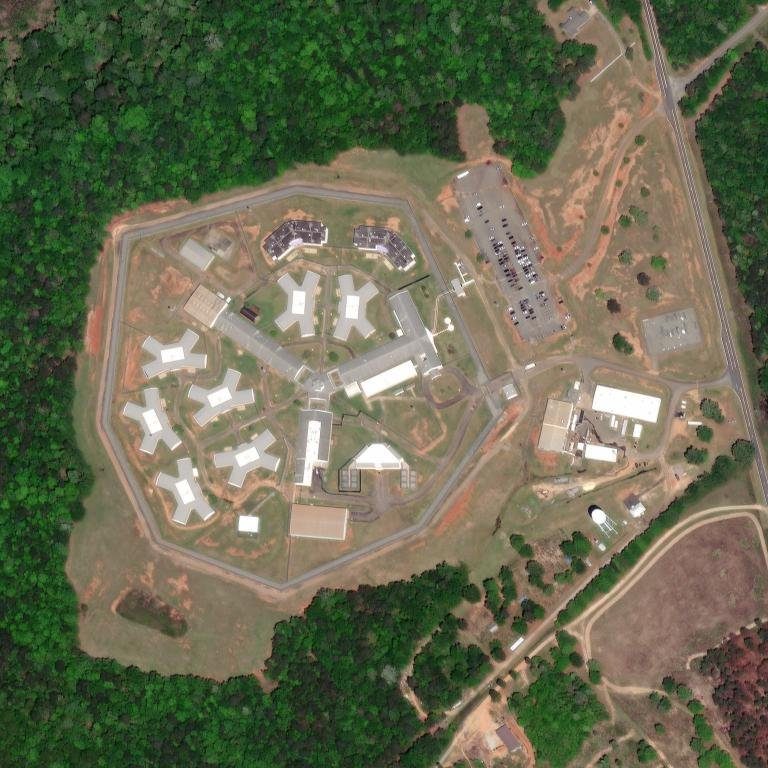
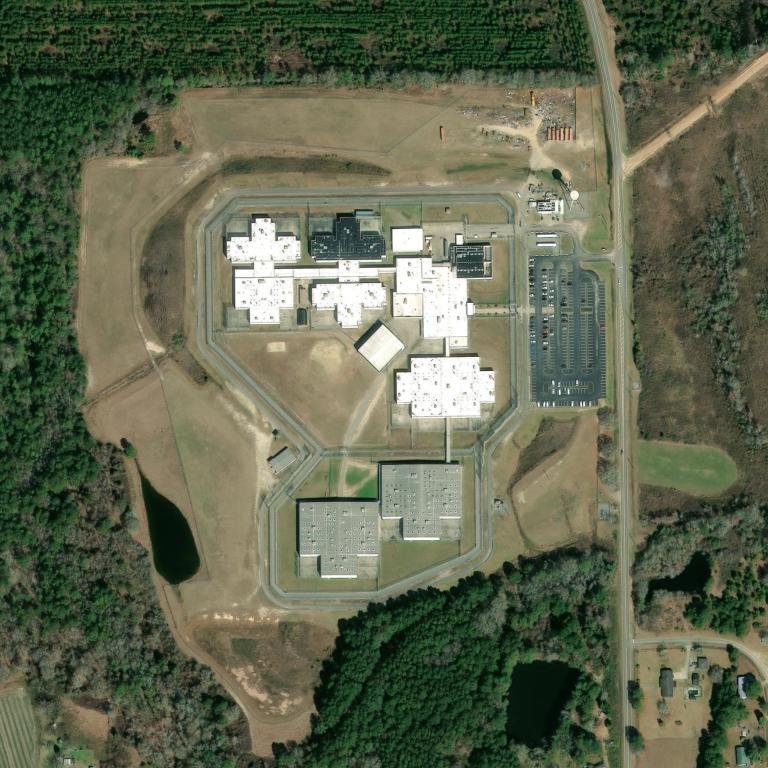
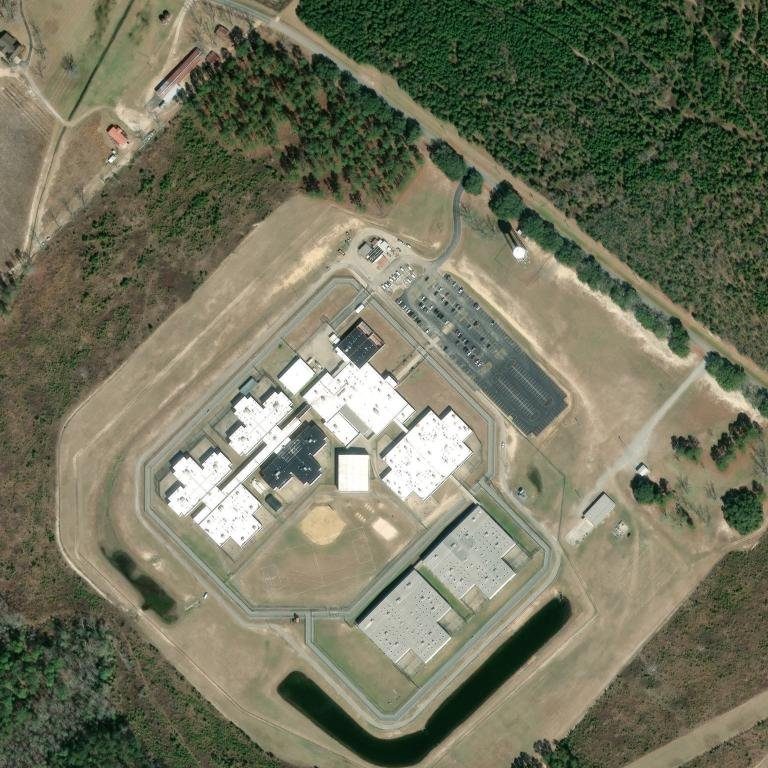
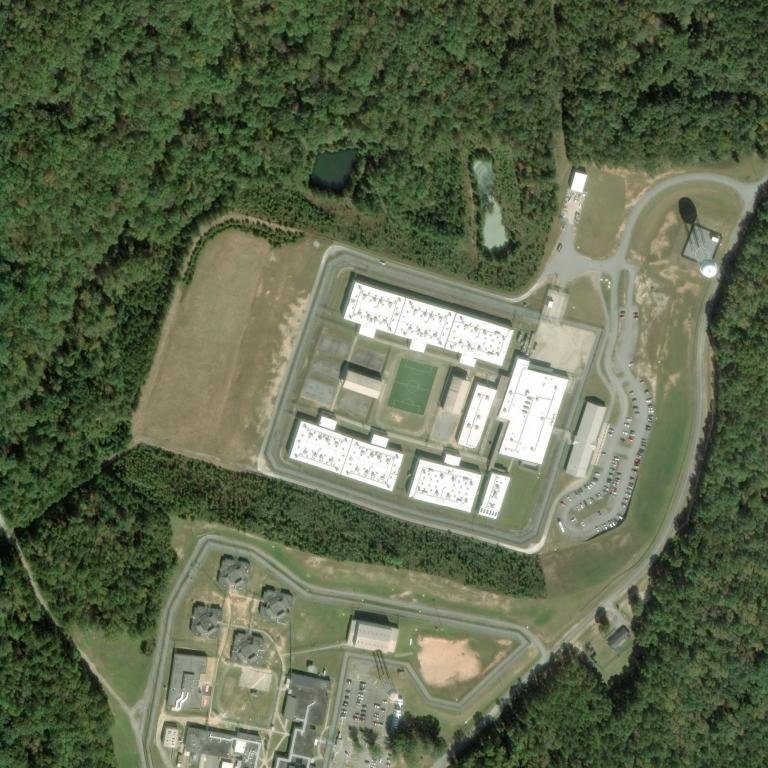
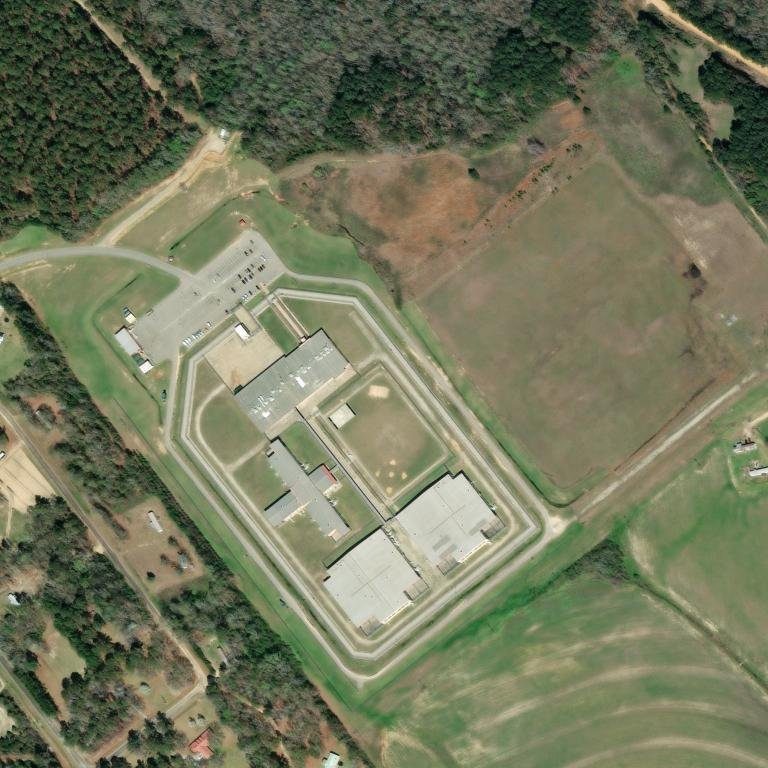
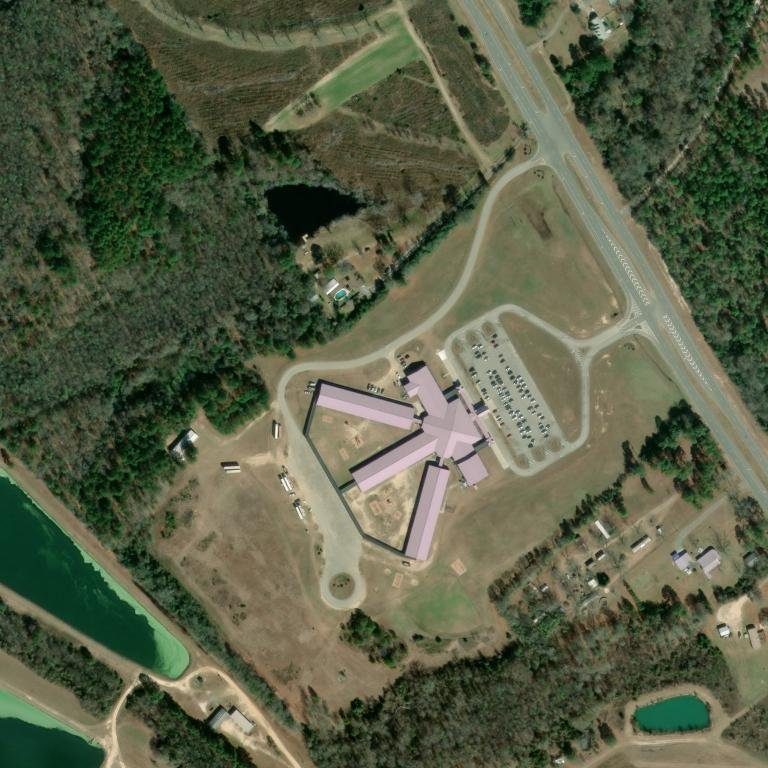
Nine prisons. One blueprint.
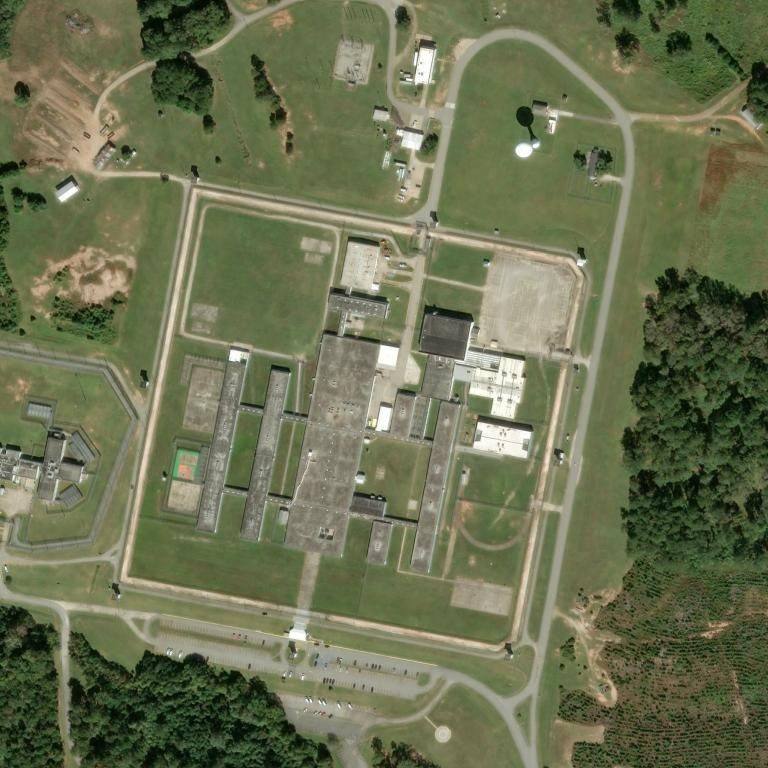
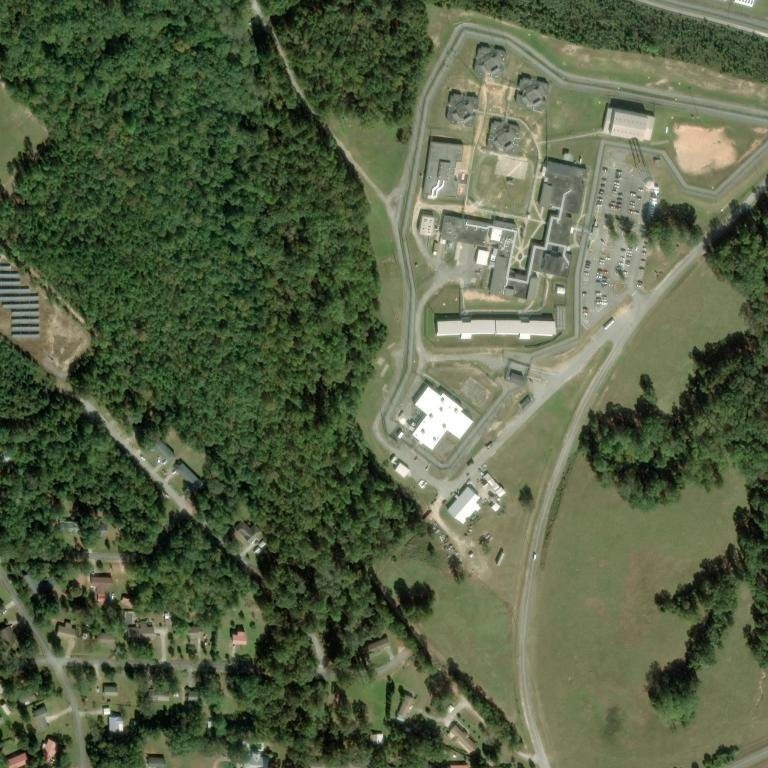
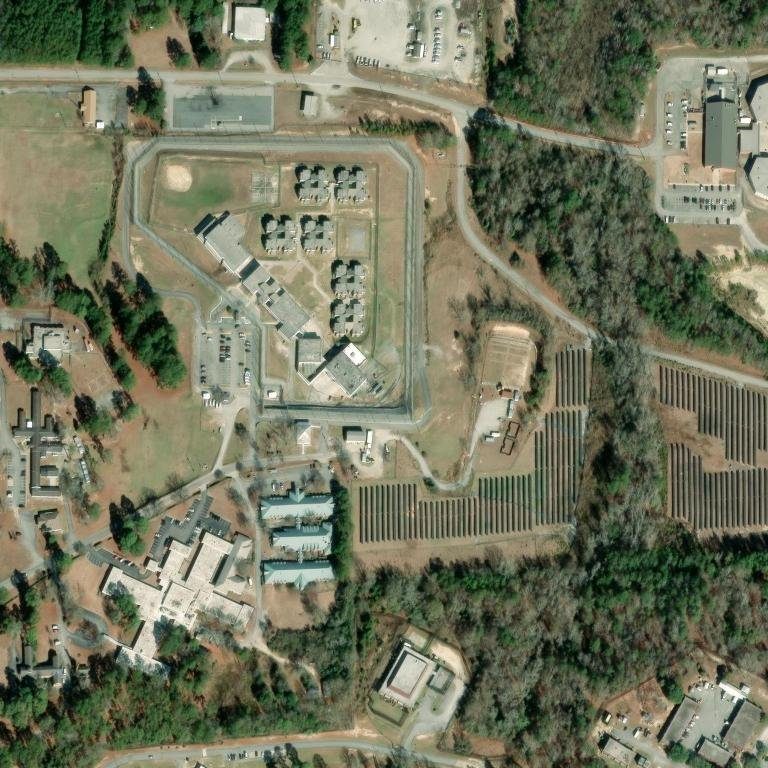
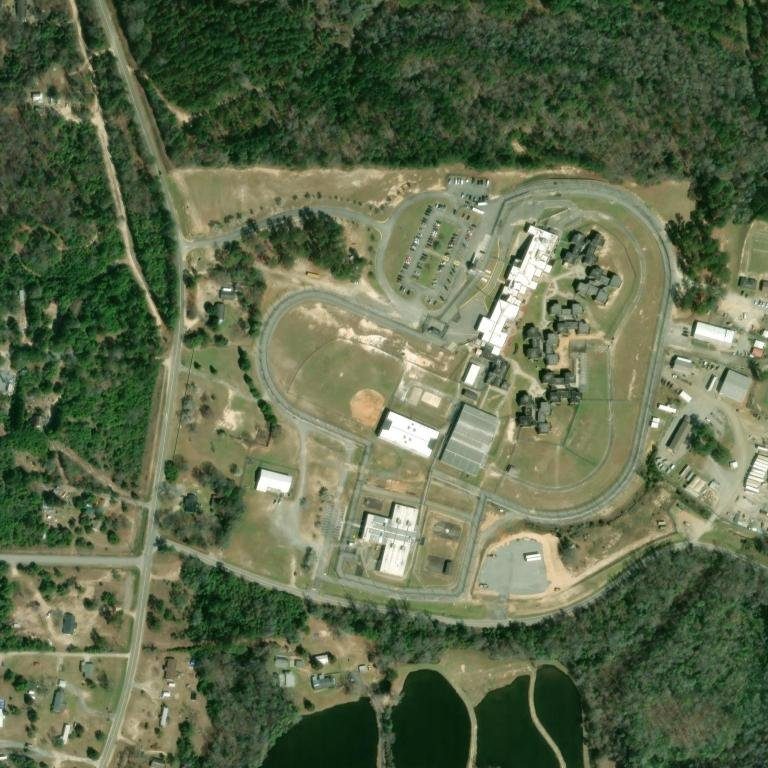
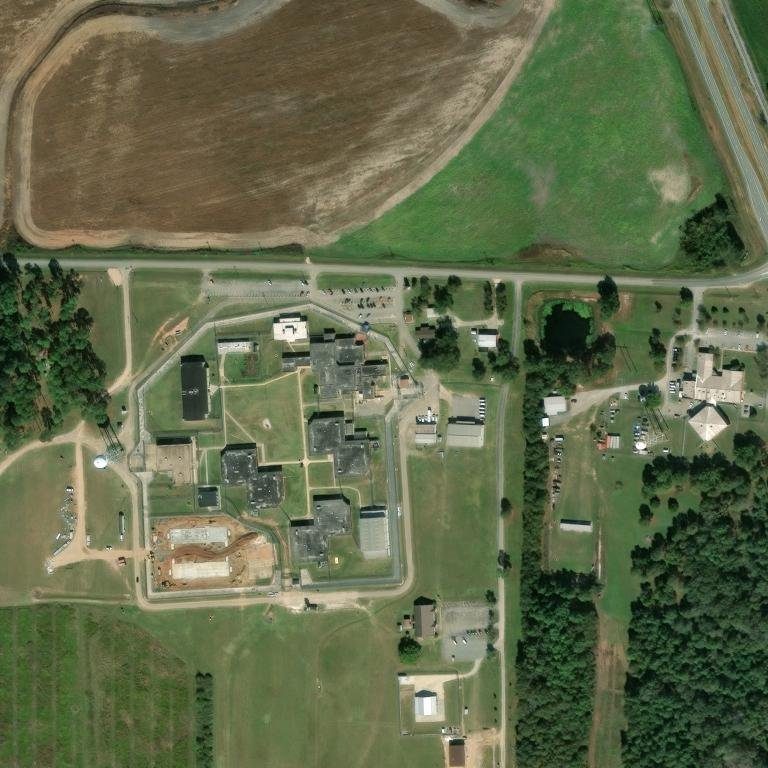
In FY1989, Georgia’s Office of Planning and Budget approved a standardized 500-cell close-security prototype with “maximum operating capacity 750 inmates.” Nine identical pentagonal-X prisons were built between 1991 and 1994 — Hancock, Washington, Johnson, Smith, Wilcox, Macon, Autry, Dooly, and Calhoun — following an earlier 1990-1992 Cohort 1 of Telfair/Hays parallel-dorm prototypes. The architecture hasn’t changed. The population has.
 | Hancock State Prison Sparta · Opened 1991 · Close security Design: 750→1,193159% of design |
 | Washington State Prison Davisboro · Opened 1991 · Medium security Design: 750→1,223163% of design |
 | Johnson State Prison Wrightsville · Opened 1992 · Medium security Design: 750→1,572210% of design |
 | Smith State Prison Glennville · Opened 1993 · Close security Design: 750→1,109148% of design GDC has acknowledged Smith as one of the deadliest prisons in the system and is actively reducing the population back toward the original single-occupancy design. The intervention is working: deaths fell from 11 in 2023 to 1 in 2025, and Smith now carries the lowest overcrowding ratio of any prison in this cohort. Proof of concept that depopulation reduces violence. |
 | Wilcox State Prison Abbeville · Opened 1993 · Medium security Design: 750→1,835245% of design GDC has acknowledged that Legionella pneumophila is present in Wilcox's water system — confirmed in two written notices to the offender population on official GDC letterhead from the Wilcox warden (December 5, 2023 and March 14, 2024) acknowledging Legionnaires' disease diagnoses among the incarcerated population. Unlike Autry, Wilcox has not been closed for remediation. Allegations in pending federal § 1983 litigation (Sullivan v. Oliver, M.D. Ga.; Ware v. Thomas, M.D. Ga.) include four documented Legionella infections in a single plaintiff and the claim that GDC staff were provided bottled water and instructed not to drink from the tap, while the incarcerated population received no equivalent protection. |
 | Macon State Prison Oglethorpe · Opened 1994 · Close security Design: 750→1,772236% of design |
 | Autry State Prison Pelham · Opened 1994 · Medium security Design: 750→51869% of design Autry was holding roughly 1,500 inmates — more than double its 750-bed design — right up until 2023, when GDC closed the facility for Legionella remediation (per GDC's own monthly population reports prior to closure). In October 2022 GDC and the Georgia Department of Public Health publicly confirmed Legionella pneumophila contamination of the facility's water supply; closure followed the next year. Autry is only now beginning a phased reopening — the current 518 figure reflects that incomplete restart, not a permanent reduction in the architecture's overcrowding profile. |
 | Dooly State Prison Unadilla · Opened 1994 · Medium security Design: 750→1,610215% of design |
 | Calhoun State Prison Morgan · Opened 1994 · Medium security Design: 750→1,663222% of design |
Every facility. Every design figure. Every source.
Every facility’s original design capacity with provenance. Verified rows have an explicit budget line citation. Proxy rows use the earliest available stable annual-report reading. Unverified rows are admin-entered and lack source notes.
Proxy Earliest-available reading
Unverified No source attached
| Facility | Opened | Design | Population | Over Design | Deaths since 2020 | Status | Note | |
|---|---|---|---|---|---|---|---|---|
 | Arrendale State Prison | 1926 | 1,200 | 314 | 26% | 24 | Verified | FY1978-79 OPB: “avg pop 1,250/1,209 as Georgia Industrial Institute” |
 | Valdosta State Prison | 1959 | 500 | 1,068 | 214% | 78 | Verified | Wikipedia: 10 GP units × 500 beds original; Annex (554) added later |
 | Georgia Diagnostic and Classification State Prison | 1968 | 500 | 4,887 | 977% | 122 | Verified | FY1974 OPB Budget: “Shelter…500 maximum security offenders.” 881 beds added by 1989 |
 | Montgomery State Prison | 1972 | 344 | 408 | 119% | 1 | Verified | FY1978/79 OPB Budgets: “avg pop 345/344”; was 400 admin estimate |
 | Walker State Prison | 1972 | 324 | 445 | 137% | 2 | Verified | FY1978/79 OPB Budgets: “avg pop 325”; FY1987-92 stable 324 |
 | Baldwin State Prison | 1976 | 504 | 775 | 154% | 65 | Proxy | Stable across FY1987 + FY1990-92 reports |
 | Rutledge State Prison | 1976 | 480 | 605 | 126% | 19 | Verified | FY1979 OPB Budget: “phased to 480; double-loaded capacity 576” |
 | Central State Prison | 1978 | 546 | 1,154 | 211% | 39 | Verified | FY1988-89 stable; FY1983 OPB master plan listed 802 (planned expansion) |
 | Lee State Prison | 1979 | 640 | 755 | 118% | 6 | Proxy | FY1988-92 stable reading; original 1979 design unknown |
 | Rogers State Prison | 1980 | 596 | 1,429 | 240% | 14 | Unverified | Admin-entered; matches FY1989 ann report (pre-1990 expansion to 984) |
 | Coastal State Prison | 1981 | 758 | 1,638 | 216% | 133 | Proxy | FY1987-88 stable reading (pre-1989 expansion to 958) |
 | Augusta State Medical Prison | 1983 | 535 | 1,165 | 218% | 388 | Verified | FY1983 OPB Budget explicit: 535 = 400 GP + 135 medical |
 | Dodge State Prison | 1983 | 404 | 1,215 | 301% | 16 | Verified | FY1983 OPB Budget explicit: 336 GP + 50 shock + 18 isolation = 404 |
 | Burruss CTC | 1986 | 300 | 743 | 248% | — | Verified | Wikipedia: opened 1986 with 300 capacity; expanded to 808 today |
 | Ware State Prison | 1990 | 500 | 1,446 | 289% | 92 | Verified | Wikipedia + FY1989 OPB; 8 housing units × 50 double cells = 400-500 single-cell design |
 | Hays State Prison | 1990 | 448 | 1,097 | 245% | 37 | Verified | Wikipedia: 7 GP dorms × 64 = 448 original (current 1,101); was 640 admin estimate |
 | Phillips State Prison | 1990 | 230 | 670 | 291% | 68 | Verified | FY1978 OPB Budget: “avg pop 230 youthful offenders” as GTDC (renamed Phillips 1990) |
 | Hancock State Prison | 1991 | 750 | 1,193 | 159% | 30 | Unverified | Admin-entered; matches Cohort 1 prototype (no explicit budget line for Hancock) |
 | Washington State Prison | 1991 | 750 | 1,223 | 163% | 50 | Verified | FY1990 OPB Budget: “Construct Washington Correctional Institution – 750 beds” |
 | Whitworth Women’s Facility | 1991 | 442 | 444 | 100% | 1 | Proxy | Current capacity used as design proxy; no known expansion since opening |
 | Telfair State Prison | 1992 | 480 | 1,175 | 245% | 59 | Unverified | Admin’s ‘6 dorms × 80 cells = 480’ math; no budget doc verifying |
 | Johnson State Prison | 1992 | 750 | 1,572 | 210% | 95 | Verified | FY1990 OPB Budget: “Construct Johnson Correctional Institution – 750 beds” |
 | Smith State Prison | 1993 | 750 | 1,109 | 148% | 40 | Verified | FY1989 budget 500-cell prototype; aerial confirms Cohort 1 X-shape |
 | Wilcox State Prison | 1993 | 750 | 1,835 | 245% | 49 | Verified | FY1990 OPB Budget: “Construct Wilcox Correctional Institution – 750 beds” |
 | Macon State Prison | 1994 | 750 | 1,772 | 236% | 89 | Verified | FY1989 budget 500-cell prototype; aerial confirms Cohort 1 X-shape |
 | Autry State Prison | 1994 | 750 | 518 | 69% | 22 | Verified | Admin-attested: same standardized 750-bed design as Dooly cohort |
 | Pulaski State Prison | 1994 | 500 | 1,184 | 237% | 32 | Verified | FY1990 OPB Budget: “Construct a 500-bed female facility in Pulaski County” |
 | Dooly State Prison | 1994 | 750 | 1,610 | 215% | 51 | Verified | FY1990 OPB Budget: “Construct Deely [Dooly] – 750 beds.” CO confirms 750 |
 | Calhoun State Prison | 1994 | 750 | 1,663 | 222% | 31 | Verified | FY1990 OPB Budget: “Construct Calhoun – 750 beds” |
 | Coffee Correctional Facility | 1998 | 1,524 | 2,744 | 180% | 25 | Verified | Wikipedia/CoreCivic: CCA built 1998. Sister-design to Wheeler. Expanded 2009 |
 | Wheeler Correctional Facility | 1998 | 1,524 | 2,784 | 183% | 47 | Verified | Wikipedia/CoreCivic: CCA built 1998. Sister-design to Coffee CF |
 | Riverbend Correctional and Rehabilitation Facility | 2011 | 1,500 | 1,515 | 101% | 10 | Verified | Wikipedia/GEO Group: built 2011 by GEO Group; current max capacity 1,588 |
 | Jenkins Facility | 2012 | 1,150 | 1,161 | 101% | 20 | Verified | Wikipedia/GDC: CCA contract Sept 2010, opened March 2012 |
 | McRae Women’s Facility | 2020 | 1,978 | 1,224 | 62% | 7 | Proxy | State women’s prison; GDC purchased from CoreCivic for $130M Dec 2022 (CCA built 2000 under federal BOP CAR contract) |
Where the numbers come from.
Every figure on this page traces to a primary public record. We harvested 12 OPB Budget Reports and 30 GDC Annual Reports from the Digital Library of Georgia, supplemented by the U.S. Department of Justice’s 2024 findings on Georgia prisons.
- U.S. Department of Justice · Investigation of the Georgia Department of Corrections (Findings Report, October 1, 2024) · cited throughout this page for correctional-officer vacancy rates, EMS delays, gang control, suicides and homicides in custody, and rigor-mortis death discoveries · justice.gov PDF
- GDC, Mission Statement (cited in the callout above) · agency homepage, gdc.georgia.gov
- FY1989 OPB Budget · “Design and construct a 500-cell correctional facility (maximum operating capacity 750 inmates)” · DLG record
- FY1983 OPB Budget · Augusta CMI design capacity 535; Dodge CI design capacity 336+50+18 = 404 cells · DLG record
- FY1990 OPB Budget · Construct Wilcox/Washington/Johnson/Mitchell/Calhoun/Dooly Correctional Institutions — 750 beds each · DLG record
- GDC FY1991 Annual Report · Commissioner’s narrative on prototype construction · DLG record
- GDC FY1997 Annual Report · System population growth chart FY88–FY97 · DLG record
- GDC FY2003 Annual Report · Per-facility population table · DLG record
This is what overcrowding looks like, prison by prison.
For the case for federal intervention, the model legislation already filed, and what families and voters can do about it — read the full investigation:
For the money side — $1.8 billion appropriated, $52 per person per year on rehabilitation — read Mission Failure. Or jump straight to Vision 2027 — GPS’s three-bill legislative package.